conduct an individual significance tests at the 5% significance level to determine if SQFT is a significant predictor of Price
Q: Use Microsoft Excel to generate regression output for this problem and use the information in the…
A:
Q: b. Find the equation of the regression line to predict course grades from placement test scores and…
A: Given: Number of students, n=20 Student Placement test, X Course grade ,Y 1 50 53 2 35 41 3…
Q: Dr. Woods tested the correlation between insulin in the blood and sugar consumption. She found that…
A: There is no error because correlation was 1.
Q: a) Using simple linear regression, find the forecasted quantity sold for Jiga Milk Tea if the price…
A: We have given there are two variable namely Price RM & Quantity sold in the table. Let us…
Q: (d) Would it be advisable to use this regression model to predict coffee shop sales for a university…
A: The regression equation is y^=60.00+5.00*x d. The coffee shop sales for a university town with 35000…
Q: A group of students looked to see if there was a linear relationship between the number of hours…
A: Given: x is the number of hours spent on social media. y is the number of sit-ups a…
Q: The data below are the final exam scores of 10 randomly selected history students and the number of…
A: Use the excel to find the linear regression for the given data. Plot the table on excel.
Q: A researcher is interested in seeing the relationship between the number of hours slept and mood.…
A: Regression: The regression analysis is conducted here by using EXCEL. The software procedure is…
Q: For the regression equation, Ŷ = –2X + 6, what can be determined about the correlation between X and…
A: The given regression line is: Ŷ = –2X + 6
Q: In a simple linear regression you are told that the estimate of the slope coefficient was 0.9 and…
A: Obtain the estimated standard error for the estimated slope coefficient. The estimated standard…
Q: The regression equation below was estimated using a random sample of 27 pairs of X, y observations.…
A:
Q: 2 3 4 5 9 6 7 7 9 15
A: We have given that, The data set are : X :- 1, 2, 3, 4, 5, 9 Y:- 4, 6, 7, 7, 9, 15 Then, We will…
Q: (d) (e) Calculate the coefficient of Pearson correlation. If the surrounding temperature in the…
A: Given data : A B 21 1 27 0.9 32 0.9 38 0.8 43 0.8 49 0.7 54 0.5 60 0.4 66 0.2…
Q: The admissions officer for Clearwater College developed the following estimated regression equation…
A: To complete the missing entries in this Excel Regression tool output. dfRegression=number of…
Q: This data was used to develop an estimated regression equation, ý = 1,405.33 + 7.44x, relating…
A: The null and alternative hypothesis is given below:
Q: The proprietor of Cypres Recordings investigated the relationship between sales (y) and the amount…
A:
Q: c.) Explain in practical terms the meaning of the skope of the regression line.
A: Part C is answered as mentioned in the question.
Q: Study Hours GPA ACT Score 1 22 17 2 33 18 3 44 20 5 44 31 5 44 31 Find the p-value for the…
A: Multiple linear regression is used to predict certain response values with the help of more than one…
Q: For the regression equation, Y’ = – 2 + X, if the mean for Y is 6, what is the mean for X?
A: From the given information, Regression equation: Y’ = – 2 + X Mean of Y =6 Thus, the mean of X can…
Q: A sports blogger is looking to determine an equation that relates a professional football…
A: we want to predict football quarterback's salary with his passer rating, touchdowns thrown, the…
Q: (d) What percentage of the variation in diastolic blood pressure can be explained by systolic blood…
A: From given data, X Y X*Y X*X Y*Y 134 87 11658 17956 7569 115 83 9545 13225 6889 113 77 8701…
Q: For a linear regression modelling how the vocabulary size of a sixth grader is affected by the…
A: Explanation: Simple linear regression: Y = a + bX Where Y is dependent variable. X is independent…
Q: Market researchers were interested in the relationship between the number of pieces in a…
A: The regression equation is y^=0.08x+1.20.
Q: (d) What percentage of the variation in diastolic blood pressure can be explained by systolic blood…
A: From given data, X Y X*Y X*X Y*Y 134 87 11658 17956 7569 115 83 9545 13225 6889 113 77 8701…
Q: In a statistics course, a linear regression equation was computed to predict the final exam score…
A:
Q: b. Using a = 0.10, determine if the slope for the regression equation is statistically significant.…
A: The data shows the amount of time in minutes a purchaser spends on its Web site and the amount of…
Q: Find the slope of the regression line for the following data.
A: x y x-x y-y (x-x)(y-y) (x-x)2 (y-y)2 1 3 -1.33 1 -1.33 1.7689 1 3 2 0.67 0 0 0.4489 0 3 1 0.67…
Q: The number of newly reported crime cases in a county in New York State is shown in the accompanying…
A: The regression analysis is conducted using EXCEL. The software procedure is given below: Enter the…
Q: The accompanying table shows results from regressions performed on data from a random sample of 21…
A: The different regression equations for the dependent variable CITY(fuel consumption) are given for…
Q: A trucking company considered a multiple regression model for relating the dependent variable y =…
A: Solution: The estimated regression equation is y^=-0.800+0.060×x1+0.900×x2
Q: Market researchers were interested in the relationship between the number of pieces in a…
A: Given that, the regression model is, Y^ = 0.08*X+1.20 Where x= number of pieces in a set.
Q: A regression between foot length (response variable in cm) and height (explanatory variable in…
A: Thanks for giving opportunity to serve for bartleby students, Hey, There ! Thank you for posting…
Q: Make up a question that would involve interpolation and the use of the model (regression equation)…
A: Since the question number is not specified, we'll be answering the first question only. Please…
Q: An admissions counselor is looking to determine an equation that relates the graduate grade point…
A: Given, the graduate grade point averages of students who are newly admitted to an academic program…
Q: For the regression equation, Ŷ = –2X + 6, if the X value is above the mean (positive deviation),…
A: We have to find correct statement for y.
Q: What would the consequence be for a regression model if the errors were not homoscedastic?
A: If the error are not homoskedastic this implies that the error term are not same. Technically it is…
Q: For a regression line in statistics, the symbol for the slope is and the symbol for the y' intercept…
A: Solution In the regression line the slope is coefficient of x and constant term is intercept.
Q: (b) What would the consequence be for a regression model if the errors were not homoscedastic? (c)…
A:
Q: A mathematics teacher wanted to see the correlation between test scores and homework. The homework…
A:
Q: a. How many apartment buildings were in the sample? b. Write the estimated regression equation (to 2…
A: a. The total degrees of freedom is 8. The number of apartment buildings were in the sample is,…
Q: Using the regression model from the previous problem, what is the interpretation of the slope…
A: The regression equation is, y= 93.51214 -0.23858 *Age - 12.79024* GPA+ 1.32088*Gender_num The slope…
Q: In the simple linear regression equation,the term b1 represents the A)estimated intercept…
A: The simple regression equation is y=b0+b1x where, y is the Response Variable b0 is the estimated…
Q: A researcher investigates the relationship between cigarette smoking (X) and work absences (Y). The…
A: 1. For dependent random variable y and the independent random variable x, the simple linear…
Q: How does R treat those observations with missing values? In other words, what role do the…
A: Regression analysis with R.
Q: A specialist in hospital administration stated that the number of FTES (full-time employees) in a…
A: Since you have posted a question with multiple sub-parts, we will solve first three sub-parts for…
Q: Provide an appropriate response. Find the equation of the regression line for the given data. -5 -3…
A:
Q: The admissions officer for Clearwater College developed the following estimated regression equation…
A:
Q: In multiple regression, when all independent variables are considered but the order in which they…
A: Stepwise Regression: At each step of a stepwise regression, a variable is considered for addition to…
Q: In a fisheries researchers experiment the correlation between the number of eggs in tge nest and the…
A: Given y =0.72x + 17.07 X=140
Q: A study was conducted to compare the average time spent in the lab each week versus course grade for…
A: Solution Regression equation is useful if correlation coefficient is high,here the correlation…
For the simple regression equation (a), conduct an individual significance tests at the 5% significance level to determine if SQFT is a significant predictor of Price.
(Check photo for data)
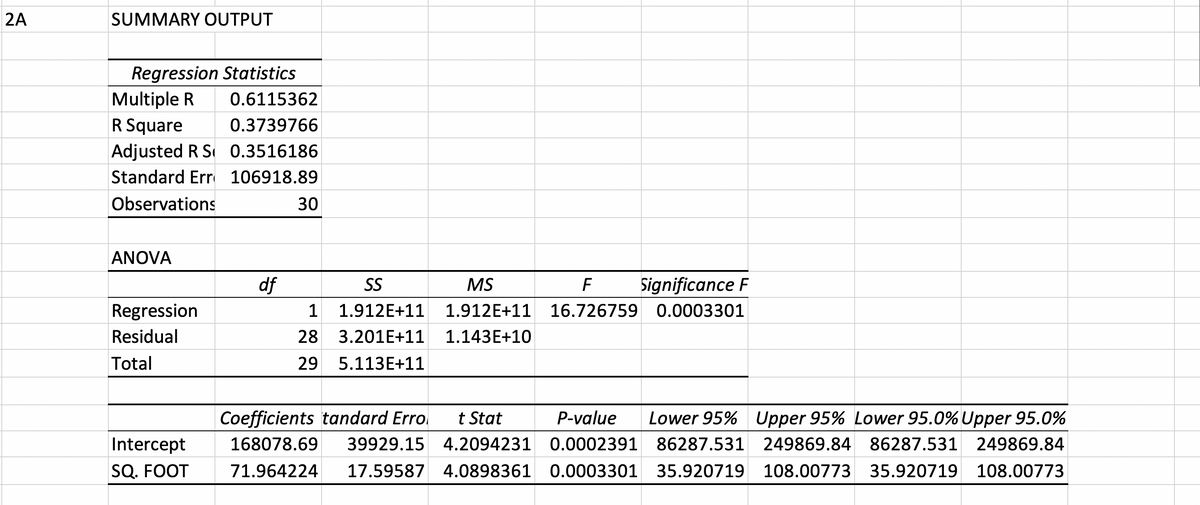
Trending now
This is a popular solution!
Step by step
Solved in 2 steps
- We have a table of cities and temperatures. Use 1 Way fixed-effects ANOVA tocalculate the F value showing your work.city temperatureOrlando 70Orlando 65Orlando 60Orlando 65Dallas 75Dallas 65Dallas 60Dallas 60Chicago 50Chicago 50Chicago 40Chicago 40The null hypothesis is H0 : µOrlando = µDallas = µChicagoWe are using the average bonuses paid to workers on Wall Street from 2000 to 2016 to fit different auto-regressive models. The data is provided below: Year Bonus($000) 2000 100.5 2001 74.1 2002 60.9 2003 99.9 2004 113.5 2005 149.8 2006 191.4 2007 177.8 2008 100.9 2009 140.6 2010 139.0 2011 111.4 2012 142.9 2013 169.8 2014 160.3 2015 136.8 2016 138.2 a. fit a third-order autoregressive model to the bonuses paid and test for the significance of the third-order autoregressive parameter (slope) (Use a = 0.05.) b. if necessary, fit a second-order autoregressive model to the bonuses paid and test for the significance of the second-order autoregressive parameter (slope). (Use a = 0.05.) c. if necessary, fit a first-order autoregressive model to the bonuses paid and test for the significance of the first-order autoregressive parameter (slope). (Use a = 0.05.) d. if…The population (in millions) and the violent crime rate (per 1000) were recorded for 10 metropolitan areas. The data are shown in the following table. Do these data provide evidence to reject the null hypothesis that ? = 0 in favor of ? ≠ 0 at ? = .05? (Give your answers correct to three decimal places.) Population 10 2.3 1.4 6 2.7 6 1.9 1.7 2.1 6.7 Crime Rate 12.4 6.7 7.8 7.4 8 7 8.9 9.1 8 7.7 (ii) Calculate the critical region. (smaller value) (larger value)
- The management of BCD Inc. would like to separate the fixed and variable components of electricity as measured against machine hours in one of its plants. Data collected over the most recent six months follow:Electricity MachineMonth Cost Hours January $1,100 4,500February 1,110 4,700March 1,050 4,100April 1,200 5,000May 1,060 4,000June 1,120 4,600Required: 1. Using the method of least squares, compute the fixed cost and the variable cost rate for electricity expense. (Round estimates to the nearest cent.) 2. Compute coefficients of correlation and determinationThe diameter of a metal shaft used in a disk-drive unit is normally distributed with mean 0.2508 in. and std. dev. 0.0005 in. The specification on the shaft have been established as (0.25-0.0015 in, 0.25+0.0015in) If the process mean has been adjusted to 0.25 in, what fraction of the shafts produced does NOT conform to specifications? a). 0.0027 b). 0.0013 c).0.08 d). 0.16A computer store sells 3 computer models priced at P26,000, 32,000, and42,000, and two brands of monitors priced at P3,200 and 3, 800, respectively.The joint pmf of X, the computer price, and Y , the monitor price, is given inthe table below. X\Y 3,200 3,800 26,000 0.30 0.25 32,000 0.20 0.10 42,000 0.10 0.05 Compute the marginal probability functions (pmf’s).
- A dietitian wishes to see if a person’s cholesterol level will be changed if the diet is supplemented by a certain mineral. Four subjects were pre-tested, and they took the mineral supplement for a 6-week period. The results are shown in the table. Is there sufficient evidence to conclude that the population mean of cholesterol levels has been changed after six weeks at α=0.2α=0.2? Assume that the differences are from an approximately normally distributed population. Subject Cholestrol Level (mg/dl) Cholestrol Level after 6 Weeks (mg/dl) dd ¯dd¯ (d−¯d)2(d-d¯)2 1 206 217 11 2 219 184 -35 3 202 204 2 4 213 205 -8 Total -30 a) Calculate the mean, the sum of the squared deviation from the mean, and the standard deviation of differences. Do not include the unit for each answer: ¯d=d¯= (do not round) ∑(d−¯d)2=∑(d-d¯)2= (do not round) sd=sd= (rounded to one decimal place) b) Perform the hypothesis test in the following steps: Step 1.…Samples are collected from the River X and pH values are observed. 9 different pH values are listed in table 3. Table 3 Concentrations 3.55 4.01 5.38 3.22 8.05 5.25 4.67 3.67 3.5Draw box plot and find a. Bowley’s coefficient of skewness b. Karl Pearson’s coefficient of skewness c. Third moment Rubric Stages of Process Marks Imagine and Plan 2Composition 2Effort 1Q1A) List down the measures of central tendency and measures of dispersion 1) Q1B) The operations manager of a plant that manufactures tires wants to compare the actual inner diameters of two grades of tires, each of which is expected to be 575 millimeters. A sample of five tires of each grade was selected, and the results representing the inner diameters of the tires, ranked from smallest to largest, are as follows. Grade X grade Y 568 570 575 578 584 573 574 575 577 578 requirement. a) for each of the tow grades of tries, compute the mwan, median, and standred deviation. b) which grade of tire providing better quality? explain. c) what would be the effect on your answer in (a) and (b) if the last value for grade Y were 588 insert 578 explain. PLEAS ANSWER Q1&B. THANK YOU.
- Derive a general expression for the variance of net future loss Var(L) with a constant force of interest δ under each of the following models:i. μ_x(t) = μii. μ_x(t) = 1/(ω-x)Data for nine girders in the form of the ratio of predicted to observed load for two procedures, the Karlsruhe and Lehigh methods, are as follows: Girder Karlsruhe Lehigh 1 1.186 1.061 2 1.151 0.992 3 1.322 1.063 4 1.339 1.062 5 1.200 1.065 6 1.402 1.178 7 1.365 1.037 8 1.537 1.086 9 1.559 1.052 1) calculate the t-value and what is your conclusion at (α = 0.05)? 2) What is the 90% confidence interval for the difference in means?Q1 A) List down the measures of central tendency and measures of dispersion 2) The operations manager of a plant that manufactures tires wants to compare the actual inner diameters of two grades of tires, each of B) which is expected to be 575 millimeters. A sample of five tires of each grade was selected, and the results representing the inner diameters of the tires, ranked from smallest to largest, are as follows. Grade X grade Y 568 570 575 578 584 573 574 575 577 578 requirement. a) for each of the tow grades of tries, compute the mwan, median, and standred deviation. b) which grade of tire providing better quality? explain. c) what would be the effect on your answer in (a) and (b) if the last value for grade Y were 588 insert 578 explain. C) The file contins the overall miles per gallon (MPG) OF 2010 family sedan: 24 21 22 23 24 34 34 34 20 20 22 22 44 32 20 20 22 20 39 20 Source:…