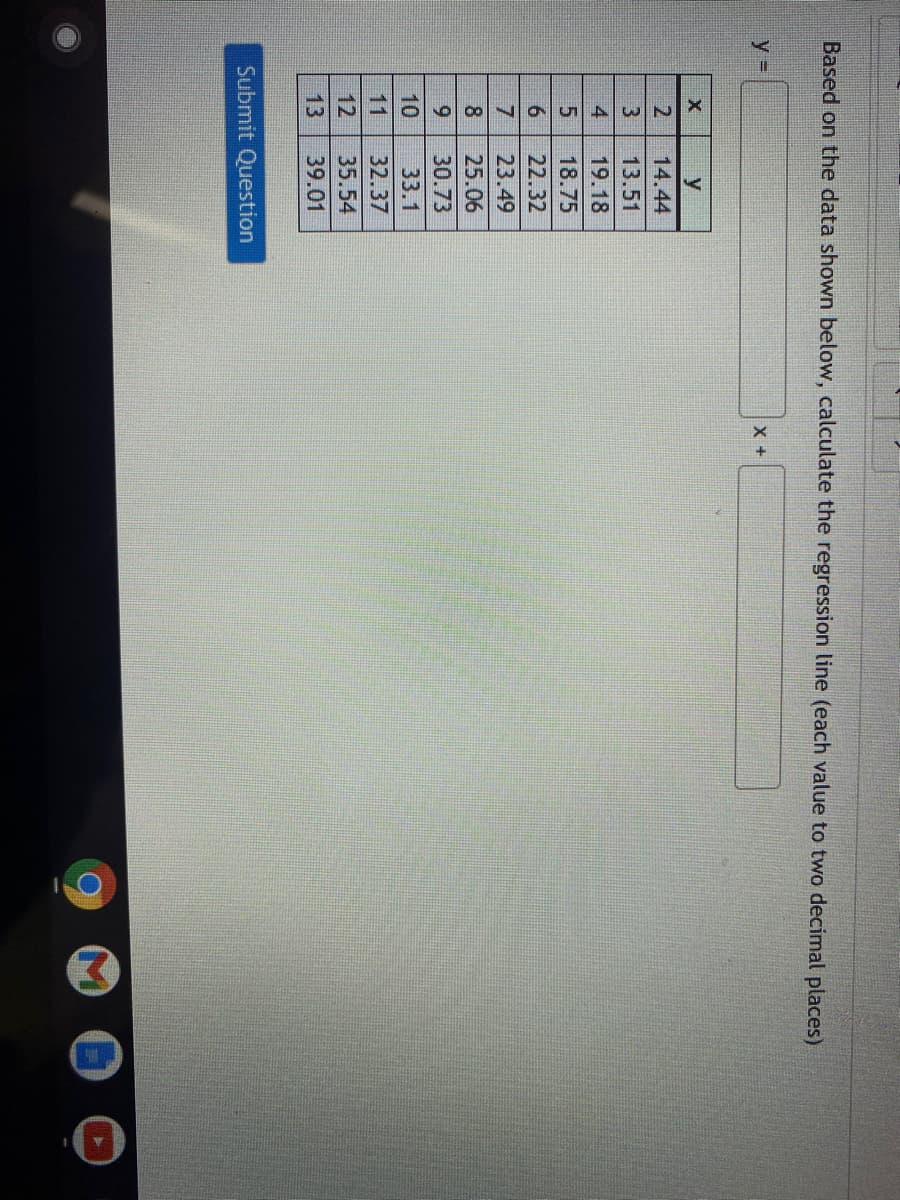
Based on the data shown below, calculate the regression line (each value to two decimal places) y%3D X + y 14.44 13.51 4 19.18 18.75 6. 22.32 23.49 8 25.06 30.73 10 33.1 11 32.37 12 35.54 13 39.01


Q: From the data given below, calculate the regression equation taking deviation of items from the mean…
A: Regression Equation = ŷ = bX + a
Q: Calculate the regression equation Y on X from the following data : Y 30 40 35 38 40 35 36 42 29 30
A: Given data is
Q: Based on the data shown below, calculate the regression line (each value to two decimal places) y =…
A: From given data, X Y X*Y X*X 5 39.05 195.25 25 6 34.94 209.64 36 7 32.63 228.41 49 8…
Q: Based on the data shown below, calculate the regression line (each value to two decimal places) y =…
A: Given data, X Y X*Y X*X 4 8 32 16 5 8.8 44 25 6 9.4 56.4 36 7 7.5 52.5 49 8 7.5 60 64…
Q: Based on the data shown below, calculate the regression line (each value to two decimal places) y…
A:
Q: Based on the data shown below, calculate the regression line (each value to at least two decimal…
A: Topic:- regression equation
Q: The following table shows the average annual income in a certain country, adjusted for inflation,…
A:
Q: Personal wealth tends to increase with age as older individuals have had more opportunities to earn…
A: (d). Determine there is a significant relationship between wealth and age at the 10% level of…
Q: Examine the scatterplot for the data in the table below. 1 17 18 30 27 28 32 13 36 37 17 39 19 40…
A: (a) The outlier present in the data is (3,30)
Q: Based on the data shown below, calculate the regression line (show each value to two decimal places)…
A:
Q: Based on the data shown below, calculate the regression line (each value to at least two decimal…
A:
Q: Calculate the regression equation of X on Y from the data given below, taking deviations from actual…
A:
Q: Based on the data shown below, calculate the regression line (each value to two decimal places) y =…
A: Regression Equation: When we want to predict the value of one variable, say y, from the given value…
Q: Use the multiple linear regression model. E(Y | X, X=231 + 1.25 X, +2.31 X, to answer the following…
A: Consider a regression model for the prediction of Y (dependent variable) with two predictors: X1 and…
Q: Based on the data shown below, calculate the regression line (each value to at least two decimal…
A:
Q: Based on the data below, calculate the regression line(each value to at least two decimal places) X…
A:
Q: Personal wealth tends to increase with age as older individuals have had more opportunities to earn…
A: Note: Hey, since multiple sub parts are posted, we will answer first three sub parts according to…
Q: ed on the data shown below, calculate the regression line (each value to two decimal places) y = x…
A: The table that shows the necessary calculations is depicted as follows: X Y X*Y X2 Y2 1…
Q: Based on the data shown below, calculate the regression line (each value to at least two decimal…
A:
Q: Based on the data shown below, calculate the regression line (each value to at least two decimal…
A: Enter the given data into the excel as follows:
Q: Based on the data shown below, calculate the regression line (each value to at least two decimal…
A: X-Mx Y-My X-Mx2 X-MxY-My-2.5 2.2 6.25 -6.25-1.5 2.58…
Q: From the following data find the coefficient of correlation and obtain the two regression equations…
A:
Q: Using the following information concerning the years of college attended and annual income (in…
A: Let the Regression Equation be γ=α ^+β⏞x α^=22 (intercept)β ^=5.6 (Regression coefficient)…
Q: Examine the scatterplot for the data in the table below. 2 14 4 18 6 19 9 33 10 24 12 25 13 26 14 27…
A: Scatterplot is also known as the scatter gram, scatter graph or scatter charts. It uses dots to…
Q: Find the linear regression line for the following table of values, where x represents years of…
A: In this case years of employment (x) is the independent variable and average percentage of share (y)…
Q: Use the given data to find the equation of the regression line. Examine the scatterplot and identify…
A: Use EXCEL to obtain the regression equation. EXCEL procedure: Go to EXCEL Go to Data>Data…
Q: Based on the data shown below, calculate the regression line (each value to at least two decimal…
A: The table that shows the necessary calculation is shown below: X Y X \cdot YX⋅Y X^2X2 Y^2Y2…
Q: Based on the data shown below, calculate the regression line (each value to two decimal places) y =…
A:
Q: Personal wealth tends to increase with age as older individuals have had more opportunities to earn…
A: "Since you have posted a question with multiple sub-parts, we will solve first three sub-parts for…
Q: The following data shows the height children with time: Age X, in (months) Height Y, in ( cm) 18 19…
A:
Q: From the data given below find the two regression equations and calculate the Standard Errors of the…
A:
Q: Use multiple linear regression to fit the following tabulated data: х1 1 1 8 8. x2 6. y 14 21 11 12…
A: Given data, x1 x2 y 1 0 14 3 2 21 1 2 11 8 4 12 2 4…
Q: Based on the data shown below, calculate the regression line (each value to two decimal places) y =…
A: Given observation and calculation is shown below x y x2 y2 xy 5 8.85 25 78.3225 44.25 6 8.66…
Q: Based on the data shown below, calculate the regression line (each value to two decimal places) y =…
A: We have to find the regression line for the given data.
Q: For the data given below from a simple linear regression model, the computed value of the sum square…
A: The formula of SSE is,
Q: Based on the data shown below, calculate the regression line (each value to two decimal places) y =…
A: Based on the data shown below, to calculate the regression line. x y 2 4.85 3 7.3 4 3.55…
Q: The following data are given X 12 15 12 3 2 17 10 Y 11 11 9 6 1 14 5 a. Construct scatter diagram…
A: Given data, X Y X*Y X*X Y*Y 12 11 132 144 121 15 11 165 225 121 12 9 108 144 81 3 6 18 9…
Q: The following demand function for a price-setting firm selling good X was estimated using standard…
A: From the estimation results, the regression equation is Q = 450 – 10P + 0.2M – 6.2PR
Q: Based on the data shown below, calculate the regression line (each value to two decimal places)y =…
A:
Q: Based on the data shown below, calculate the regression line (each value to at least two decimal…
A: Given data; x y x^2 y^2 x⋅y 4 17.56 16 308.3536 70.24 5 19.25 25 370.5625 96.25 6 22.04 36…
Q: Use quartic regression to model the following data set. (Round your regression parameters to two…
A: ACCORDING to the problem, we have
Q: Use quartic regression to model the following data set. (Round your regression parameters to two…
A: We have to find the quadrtic regression to model the given data set.
Q: Based on the data shown below, calculate the regression line (each value to at least two decimal…
A: Given data are x y 2 25.87 3 24.06 4 22.45 5 21.84 6 22.93…
Q: For the given data, use a linear regression equation. 0.4 1.2 2.0 3.1 4.5 5.7 7.1 7.8 7.1 6.8 6.0…
A: The linear regression can be obtained by the formula . Here, the terms a and b are obtained from the…
Q: Consider the following estimated regression model relating annual salary to years of education and…
A:
Q: Based on the data shown below, calculate the regression line (each value to two decimal places) y =…
A: The following data has been given: x y 3 18.66 4 20.18 5 21.4 6 22.22 7 21.44 8 23.56…
Q: Please answer the following multiple choice question. View attached image for the question
A:
Q: Run a regression analysis on the following data set, where y is the final grade in a math class and…
A: In order to obtain the least square regression line, first perform regression analysis on the data.…
Q: Based on the data shown below, calculate the regression line (each value to at least two decimal…
A: Given: First enter this data into ExcelNow,
Q: Based on the data shown below, calculate the regression line (show each value to two decimal places)…
A:

Step by step
Solved in 5 steps with 26 images


- For the following exercises, use Table 4 which shows the percent of unemployed persons 25 years or older who are college graduates in a particular city, by year. Based on the set of data given in Table 5, calculate the regression line using a calculator or other technology tool, and determine the correlation coefficient. Round to three decimal places of accuracyFor the following exercises, consider the data in Table 5, which shows the percent of unemployed in a city ofpeople25 years or older who are college graduates is given below, by year. 41. Based on the set of data given in Table 7, calculatethe regression line using a calculator or othertechnology tool, and determine the correlationcoefficient to three decimal places.For the following exercises, consider the data in Table 5, which shows the percent of unemployed ina city of people 25 years or older who are college graduates is given below, by year. 40. Based on the set of data given in Table 6, calculate the regression line using a calculator or other technology tool, and determine the correlation coefficient to three decimal places.
- Use the following data to perform a regression analysis. What is the null hypothesis? What is the alternative Hypothesis? What is the R2 Month Sales 1 132 2 131 3 134 4 140 5 141 6 142 7 144 8 143 9 146 10 145 11 148 12 148The following regression model was fitted to sample data with 12 observations: ŷ = 30 + 4.50x. What is the predicted value of y for a given value of x = 6? 57.00 43.40 4.50 36 30A researcher interested in explaining the level of foreign reserves for the country of Barbados estimated the following multiple regression model using yearly data spanning the period 2001 to 2016: ??=?+????+????+???? Where FR = yearly foreign reserves ($000’s), OIL = annual oil prices, EXP = yearly total exports ($000’s) and FDI = annual foreign direct investment ($000’s). Predictor Coef StDev t-ratio p-value Constant 5491.38 2508.81 2.1888 0.0491 OIL 85.39 18.46 4.626 0.0006 EXP -377.08 112.19 -3.361 0.0057 FDI -396.99 160.66 -2.471 ** S =2.45 R-sq = 96.3% R-sq (adj) = 95.3% (a) Fill in the missing values ‘**’, and ‘??’ (b) Hence test…
- A researcher interested in explaining the level of foreign reserves for the country of Barbados estimated the following multiple regression model using yearly data spanning the period 2001 to 2016: ??=?+????+????+???? Where FR = yearly foreign reserves ($000’s), OIL = annual oil prices, EXP = yearly total exports ($000’s) and FDI = annual foreign direct investment ($000’s). Predictor Coef StDev t-ratio p-value Constant 5491.38 2508.81 2.1888 0.0491 OIL 85.39 18.46 4.626 0.0006 EXP -377.08 112.19 -3.3611 0.0057 FDI -396.99 160.66 -2.471 0.0000 S =2.45 R-sq = 96.3% R-sq (adj) = 95.3% Analysis of Variance Source DF…A researcher interested in explaining the level of foreign reserves for the country of Barbados estimated the following multiple regression model using yearly data spanning the period 2001 to 2016: ??=?+????+????+???? Where FR = yearly foreign reserves ($000’s), OIL = annual oil prices, EXP = yearly total exports ($000’s) and FDI = annual foreign direct investment ($000’s). Predictor Coef StDev t-ratio p-value Constant 5491.38 2508.81 2.1888 0.0491 OIL 85.39 18.46 4.626 0.0006 EXP -377.08 112.19 * 0.0057 FDI -396.99 160.66 -2.471 ** S =2.45 R-sq = 96.3% R-sq (adj) = 95.3% Analysis of Variance Source DF SS…A researcher interested in explaining the level of foreign reserves for the country of Barbados estimated the following multiple regression model using yearly data spanning the period 2001 to 2016: ??=?+????+????+???? Where FR = yearly foreign reserves ($000’s), OIL = annual oil prices, EXP = yearly total exports ($000’s) and FDI = annual foreign direct investment ($000’s). Predictor Coef StDev t-ratio p-value Constant 5491.38 2508.81 2.1888 0.0491 OIL 85.39 18.46 4.626 0.0006 EXP -377.08 112.19 * 0.0057 FDI -396.99 160.66 -2.471 ** S =2.45 R-sq = 96.3% R-sq (adj) = 95.3% Analysis of Variance Source DF SS…
- Paul Consultancy took a random sample of the monthly office rents per square meter and the percentage of vacancy office space in fifteen different cities. The results are shown in the table: (Use 3 decimal places) Vacancy rate Monthly rent 15 8000 12 7500 11 5300 8 6200 6 4500 10 5000 9 6000 9 6500 12 7000 20 10000 21 9500 15 9000 8 7500 9 8800 20 11000 Determine the following: a: ? b: ? r: ? r2: ? MS regression: ? MS residual: ? F ratio: ? F0.05: ?Use the following data to perform a regression analysis. What is the regression equation? Is it significant? How can you tell? What is the forecast for month 13? Month Sales 1 132 2 131 3 134 4 140 5 141 6 142 7 144 8 143 9 146 10 145 11 148 12 148Using the previous regression model, what salary would you expect a student with a 3.1 GPA to expect? Round your answer to 1 decimal and express in $1,000's (same format the Salary variable has in the Excel dataset).

