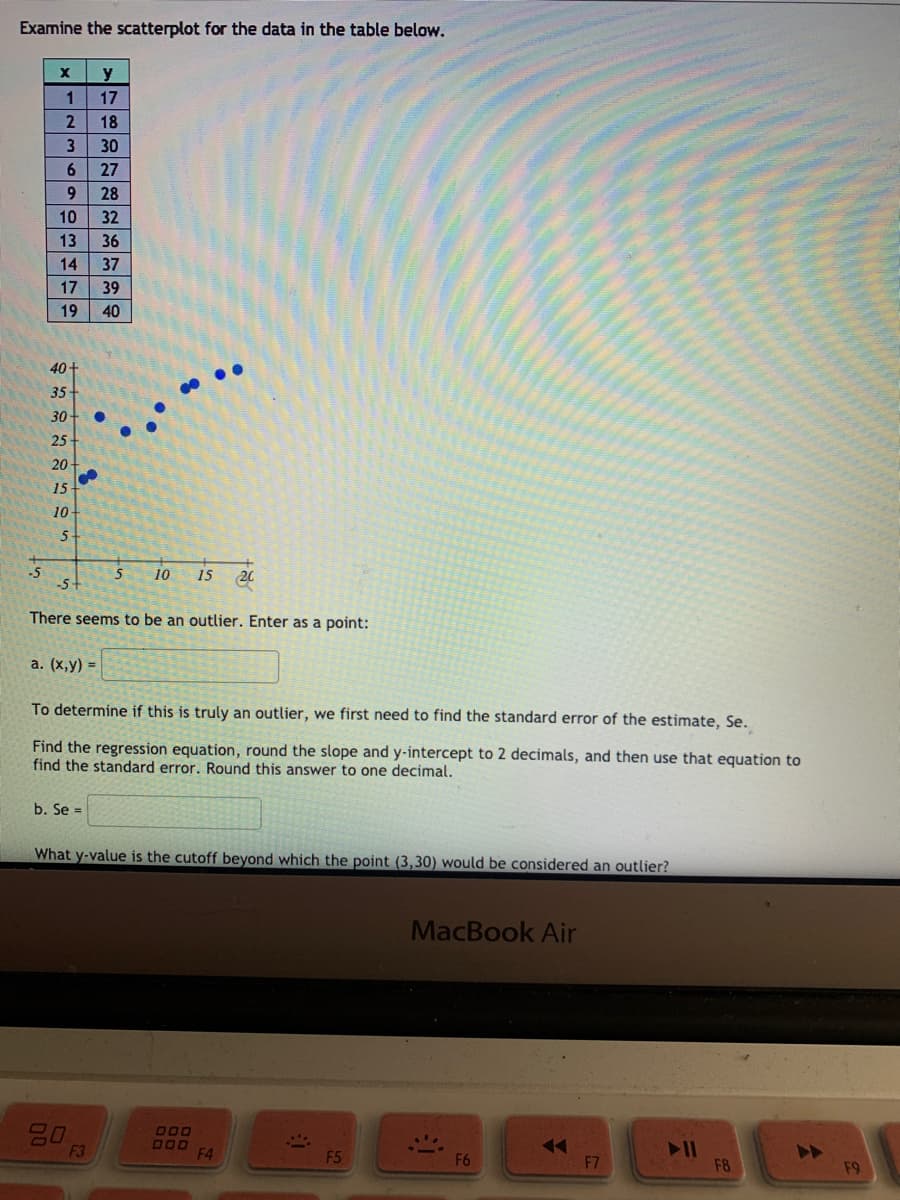
Examine the scatterplot for the data in the table below. 1 17 18 30 27 28 32 13 36 37 17 39 19 40 40+ 35 30- 25 20 15 10 -5 -5+ 5 10 15 There seems to be an outlier. Enter as a point: a. (x,y) = To determine if this is truly an outlier, we first need to find the standard error of the estimate, Se. Find the regression equation, round the slope and y-intercept to 2 decimals, and then use that equation to find the standard error. Round this answer to one decimal. b. Se = 23 19602M479

Functions and Change: A Modeling Approach to College Algebra (MindTap Course List)
6th Edition
ISBN:9781337111348
Author:Bruce Crauder, Benny Evans, Alan Noell
Publisher:Bruce Crauder, Benny Evans, Alan Noell
Chapter5: A Survey Of Other Common Functions
Section5.6: Higher-degree Polynomials And Rational Functions
Problem 1TU: The following fictitious table shows kryptonite price, in dollar per gram, t years after 2006. t=...
icon
Related questions
icon
Concept explainers
Question
What y-value is the cutoff beyond which the point (3,30) would be considered an outlier?
c. The cutoff is y =
d. Is the point (3,30) an outlier?
O No
O Yes
Submit Question
MacBook Air
20
F3
O00
F4
F5
F6
F7
F8
23
2$
&
6.
8.
5
%S4
#3
Transcribed Image Text:What y-value is the cutoff beyond which the point (3,30) would be considered an outlier? c. The cutoff is y = d. Is the point (3,30) an outlier? O No O Yes Submit Question MacBook Air 20 F3 O00 F4 F5 F6 F7 F8 23 2$ & 6. 8. 5 %S4 #3
Examine the scatterplot for the data in the table below.
y
1
17
18
30
27
28
10
32
13
36
14
37
17
39
19
40
40
35
30
25
20
15
10
5-
-5
-5-
5
10
15
20
There seems to be an outlier. Enter as a point:
a. (x,y) =
To determine if this is truly an outlier, we first need to find the standard error of the estimate, Se.
Find the regression equation, round the slope and y-intercept to 2 decimals, and then use that equation to
find the standard error. Round this answer to one decimal.
b. Se =
What y-value is the cutoff beyond which the point (3,30) would be considered an outlier?
MacBook Air
000
D00
F4
F3
F5
F6
F7
F8
F9
Transcribed Image Text:Examine the scatterplot for the data in the table below. y 1 17 18 30 27 28 10 32 13 36 14 37 17 39 19 40 40 35 30 25 20 15 10 5- -5 -5- 5 10 15 20 There seems to be an outlier. Enter as a point: a. (x,y) = To determine if this is truly an outlier, we first need to find the standard error of the estimate, Se. Find the regression equation, round the slope and y-intercept to 2 decimals, and then use that equation to find the standard error. Round this answer to one decimal. b. Se = What y-value is the cutoff beyond which the point (3,30) would be considered an outlier? MacBook Air 000 D00 F4 F3 F5 F6 F7 F8 F9
Expert Solution
steps

Step by step

Solved in 4 steps with 3 images

Blurred answer
Knowledge Booster
Correlation, Regression, and Association
Learn more about
Need a deep-dive on the concept behind this application? Look no further. Learn more about this topic, statistics and related others by exploring similar questions and additional content below.
Similar questions
  • SEE MORE QUESTIONS
Recommended textbooks for you
Functions and Change: A Modeling Approach to Coll…
Algebra
ISBN:
9781337111348
Author:
Bruce Crauder, Benny Evans, Alan Noell
Publisher:
Cengage Learning
Algebra & Trigonometry with Analytic Geometry
Algebra
ISBN:
9781133382119
Author:
Swokowski
Publisher:
Cengage
College Algebra
College Algebra
Algebra
ISBN:
9781305115545
Author:
James Stewart, Lothar Redlin, Saleem Watson
Publisher:
Cengage Learning
Algebra and Trigonometry (MindTap Course List)
Algebra
ISBN:
9781305071742
Author:
James Stewart, Lothar Redlin, Saleem Watson
Publisher:
Cengage Learning