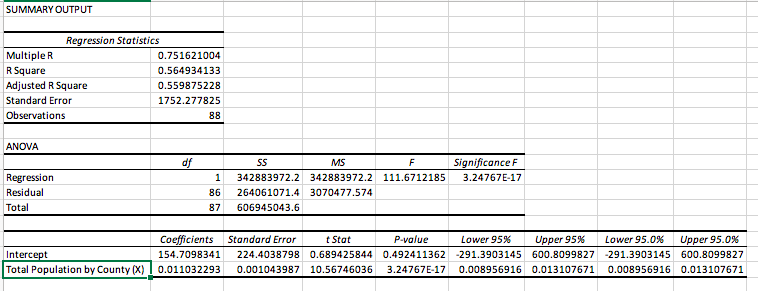
Based on the descriptive statistics below, 1. Write the estimated linear regression equation for predicting the dependent variable ( ŷ ). 2. Calculate the 95% Confidence Interval Mean predicted y ± 2* s y.x ( ± 2* s y.x Standard Error of the Estimate) Show calculations below: 3. Do approximately 95% of your observations fall within the dependent variable’s mean ± 2*standard error of the estimate (s y.x value) from the regression line (P468)? What does this mean?


Correlation
Correlation defines a relationship between two independent variables. It tells the degree to which variables move in relation to each other. When two sets of data are related to each other, there is a correlation between them.
Linear Correlation
A correlation is used to determine the relationships between numerical and categorical variables. In other words, it is an indicator of how things are connected to one another. The correlation analysis is the study of how variables are related.
Regression Analysis
Regression analysis is a statistical method in which it estimates the relationship between a dependent variable and one or more independent variable. In simple terms dependent variable is called as outcome variable and independent variable is called as predictors. Regression analysis is one of the methods to find the trends in data. The independent variable used in Regression analysis is named Predictor variable. It offers data of an associated dependent variable regarding a particular outcome.
Based on the
1. Write the estimated linear regression equation for predicting the dependent variable ( ŷ ).
2. Calculate the 95% Confidence Interval
( ± 2* s y.x Standard Error of the Estimate)
Show calculations below:
3. Do approximately 95% of your observations fall within the dependent variable’s mean ± 2*standard error of the estimate (s y.x value) from the regression line (P468)? What does this mean?

Step by step
Solved in 2 steps


