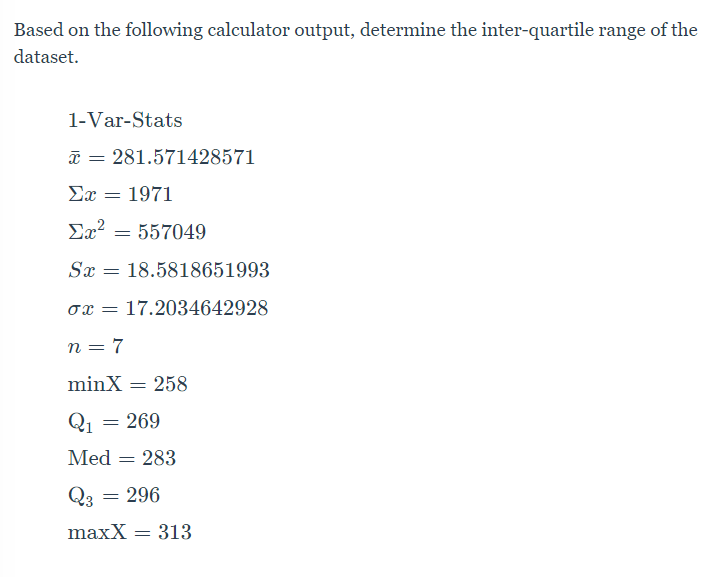
Based on the following calculator output, determine the inter-quartile range of the dataset. 1-Var-Stats T = 281.571428571 Σα-1971 Ex? = 557049 Sx = 18.5818651993 ox = 17.2034642928 n = 7 minX 258 Q1 269 Med 283 Q3 296 maxX = 313


Q: The following table illustrates the BMI for a number of patients recently enrolled in a study…
A: Given information- Sample size, n = 6 Sample mean, x-bar = 1075 cm/sec Sample standard deviation, σ…
Q: x1 1 2 3 4 5 y1 3 7 5 11 14
A:
Q: For the following data, state the null and alternative hypotheses. What is the chi-square and the…
A: Formulation of HypothesisNull Hypothesis H0: - The distribution is uniformAlternative Hypothesis H1:…
Q: Q1/A/ Calculate the lower and the upper quartiles and the coefficient of skewness based on Karl…
A: The values which divide a frequency distribution of a variable into four equal parts, are said to be…
Q: A study was recently conducted in which people were asked to indicate which news medium was their…
A: We know that, if we are going to test of independent of attributes for (r x s) contingency table, we…
Q: From the datas given below, calculate Karl Pearson's, Bowley's, and Kelly's Coefficients of…
A: Answer:
Q: Conduct an indepndent- measures t-test using the following data set: Group 1: 12 10 15 12 4 16…
A: Introduction: Denote μ1, μ2 as the true population means for Group 1 and Group 2, respectively.
Q: A study done on 8 cars measuring the nitrogen oxide emissions (g/m) obtained the following data:…
A:
Q: CONSIDER that the data is CORRELATED use alpha .05. Provide the following: 1. CI of the F value 2.…
A: Red Orange yellow green blue 43 39 38 33 31 39 43 39 35 34 41 44 40 34 32 42 35 39 37 32…
Q: What is the standard error of the difference between the means of population 1 and population 2,…
A: Answer:-
Q: Consider the following data set X; |-1| 2|3 Yi | 3 |2|1 and the model y = a, + a1x Calculate the…
A: Introduction: The values of xi and yi are given, and a model of the form: y = a0 + a1 x must be…
Q: The random sample of 7 pairs of observations from the normal population gives the following…
A: First we state the hypothesis for the given question. Null hypothesis, Ho: the two variables X and Y…
Q: 10. For the following data, what are the dt values for repeated-measures for both dfb, dfw and df…
A: dfbetween=k-1=3-1=2 dfwithin=∑df=3-1+3-1+3-1=2×2×2=8
Q: irline passengers were asked two questions: #1, In the past year, when traveling for business, what…
A:
Q: Use the given data to find the 95% confidence interval estimate of the population mean μμ. Assume…
A: The summary of the statistics is, The degree of freedom is, Critical value: By using the t-tables,…
Q: For each of the following tobs Values, determine the highest level of significance associated with…
A: Answer:i) tabsdt4.00017Decision → Reject Ha for two tailed testhighest level of significance =…
Q: Consider the following measurements of blood hemoglobin concentrations (in g/dL) from three human…
A: Test hypotheses: There are 3 populations. Denote the true mean of each of the 3 populations as μ1,…
Q: Calculate a Pearson's r using the following set of raw scores. Participant 国 Y 12 8. b. 17 3. 22 8…
A: (1A) Use EXCEL to obtain the value correlation coefficient r: EXCEL procedure: Go to EXCEL…
Q: Given are five observations for two variables, x and y. xi 2 7 15 18 20 yi 60 51 42 12 14 Use the…
A: “Since you have posted a question with multiple sub-parts, we will solve the first three sub-parts…
Q: Samples of head breadths were obtained by measuring skulls of Egyptian males from three different…
A: (a) Define the parameters. The parameters are defined below as follows: From the information,…
Q: b) Following regression output is based on a sample of 30 farms where Y = output of rice per acre in…
A: RSS : residuals sum of squares.
Q: For each of the following scenarios, select the test (from the choices below), that is most…
A: 1. e) 1-Way ANOVA A 1-way ANOVA is used to compare the means of more than two independents groups in…
Q: Consider the following summary output, which was generated from a sample of 8 employees relating age…
A: From the given data R^2 = ? R^2 = 0.019068636
Q: A study was recently conducted in which people were asked to indicate which news medium was their…
A: The chi-square test of independence is used to determine if there is a significant relationship…
Q: Consider the following measurements of blood hemoglobin concentrations (in g/dL) from three human…
A: Test hypotheses: There are 3 populations. Denote the true mean of each of the 3 populations as μ1,…
Q: What is the t critical value when n = 17 and C = 95%? 2.145 b. 2.120 O c. 2.110 Od. 2.131 What is…
A:
Q: Write out the null and alternative hypothesis in *words and symbols*. What is the hypothesis in…
A: Drug A (X) Drug B (Y) (X-xbar)^2 (Y-Ybar)^2 48.2 52.3 13.7641 18.0625 54.6 57.4 7.2361…
Q: To test whether the mean time to mix a batch of adhesive is the same for machines produced by four…
A: For the given data perform Anova: Single Factor
Q: Participant Rock Classical Heavy Metal ROW MEANS = 1 70 64 90 74.67 2 78 69 85 77.33…
A:
Q: Two samples, each with n = 9 scores, produce an independent-measures t statistic of t = 2.00. If the…
A: Given information Two samples each with n = 9 scores D.O.F = 9 + 9 – 2 = 16 t = 2
Q: Use the following SPSS output to answer the questions. Use an alpha level of .05: Which variable is…
A: (1) In any contingency table, the categories of the independent variable are represented at the top…
Q: Assuming the populations of measurements to be ap- proximately normally distributed, test the…
A: A (X) B (Y) (X-xbar)^2 (y-ybar)^2 0.86 0.87 0.01310 0.03956 0.82 0.74 0.00554 0.00475 0.75…
Q: Use the standard error to construct a approximate prediction interval for Y using an alpha of 5%.…
A:
Q: An article reports the following values for soil heat flux of eight plots covered with coal dust.…
A: Given that the mean soil heat flux for plots covered only with grass is 29 Claim : The coal dust is…
Q: Calculate the first quartile Q1 for the following data: 1 367889 2 34455567 3 0246 4 3479 5 12 O 19…
A: The data is given in the form of a stem and leaf plot. Now, the actual data is given below. 13, 16,…
Q: The following output was obtained from a multiple regression analysis. Analysis of variance…
A: Given, Predictor Coefficient SE T Intercept 3 1.5 2 X1 4 3 1.33 X2…
Q: A researcher conducts an experiment comparing two methods of teaching young children to read. An…
A: Given, t(120) = 2.10 p-value = 0.04 An older method is compared with a newer one, and the mean…
Q: The following data were obtained in an experiment designed to check whether there is a systematic…
A: a)To test:H0:μd=0H1:μd≠0where μd=μ1-μ2
Q: As a bonus assignment a former student checked if your professor gave a statisticallysignificant…
A: We have to perform Z test for testing the difference in the proportion.
Q: The following output was obtained from a multiple regression analysis. Analysis of variance…
A:
Q: For the same data set above, if we set our alpha .01, find the critical r from the table:
A: It is given that Number of observations n = 15 SSx = 4, SSy = 25 and SP = 6
Q: In a sample of seven cars, each car was tested for nitrogen oxide emissions (in grams per mile). The…
A: Here, sample size = n = 7. Sample mean: x=0.13+...+0.087=0.13 Sample standard deviation:…
Q: Based on the following calculator output, determine the inter-quartile range of the dataset.…
A:
Q: Given the following table for one way ANCOVA (3 TRTS with 5 observation each). Source SS df MS TRT…
A: Randomized block design is an experimental design where the units are called blocks and treatments…
Q: Lactation promotes a temporary loss of bone mass to provide adequate amounts of calcium for milk…
A: Let μD represents the true average difference between total body bone mineral content during…
Q: Consider the following regression: Salary, 478807.0504 + 735832.7839Experience, +11921192.95Japanese…
A: The predicted value of Y is equal linear function of X. The regression equation helps to predict the…
Q: Consider the following measurements of blood hemoglobin concentrations (in g/dL) from three human…
A: Given Information: population1 = [ 14.7 , 15.22, 15.28, 16.58, 15.10 ] population2 = [ 15.66,…
Q: a. Do the results indicate a significantly higher estr- mated speed for the "smashed into" group?…
A: The solution is given as follows-
Q: Refer to the below table. Using an alpha = 0.05, test the claim that IQ scores are the same for…
A: The null and alternative hypotheses are shown below: H0: The IQ scores are the same for children in…
Q: Construct a 95% confidence interval for the average value of y for the following data. Use x = 25,…
A: Solution: Given information: The estimated regression equation is y^= 16.920+0.160x Se= 4.77…


Trending now
This is a popular solution!

Step by step
Solved in 2 steps


- A researcher conducted a repeated measures study comparing three treatment conditions. Refer to attached images and tale to answer a to d. Mean Std. Deviation N Treatment I 1.00 1.414 5 Treatment II 5.00 2.345 5 Treatment III 6.00 1.581 5 In APA format, report the F-ratio related to the treatment effect: Is this treatment effect significant? What is the partial η2 value for the treatment effect? Is this a weak, moderate, or strong effect?A new drug for pain relief is being tested within a given palliative care population. The new drug is being compared to an already approved pain relief drug that is commonly used in providing palliative care to patients who experience chronic severe pain. Assume the patients are asked to rate the pain on a scale from 1 to 10, and the data presented below was obtained from a small study designed to compare the effectiveness of the two drugs. Set up and interpret the results of a Mann-Whitney U test with an alpha of .05. Pain Rating as Reported by Patients Old Drug 1 2 2 4 6 New Drug 1 2 2 3 7 Old Drug New Drug Total Sample (Ordered Smallest to Largest) Ranks Old Drug New Drug Old Drug New Drug 1 1 1 1 1.5 1.5 2 2 2 2 4.5 4.5 2 2 2 2 4.5 4.5 4 3 3 7 6 7 4 8 6…A new drug for pain relief is being tested within a given palliative care population. The new drug is being compared to an already approved pain relief drug that is commonly used in providing palliative care to patients who experience chronic severe pain. Assume the patients are asked to rate the pain on a scale from 1 to 10, and the data presented below was obtained from a small study designed to compare the effectiveness of the two drugs. Set up and interpret the results of a Mann-Whitney U test with an alpha of .05. Pain Rating as Reported by Patients Old Drug 1 3 3 4 6 New Drug 1 2 3 3 7
- A new drug for pain relief is being tested within a given palliative care population. The new drug is being compared to an already approved pain relief drug that is commonly used in providing palliative care to patients who experience chronic severe pain. Assume the patients are asked to rate the pain on a scale from 1 to 10, and the data presented below was obtained from a small study designed to compare the effectiveness of the two drugs. Set up and interpret the results of a Mann-Whitney U test with an alpha of .05. Pain Rating as Reported by PatientsOld Drug 1 2 2 4 6 New Drug 1 2 2 3 7Old Drug New Drug Total Sample(Ordered Smallest to Largest) RanksOld Drug New Drug Old Drug New DrugR1= R2= A) We reject H0 in favor of H1, which states the two populations are not equal at the alpha equals .05 level because the calculated U value of 12.5 is greater than the critical U value of 2.B) We reject H0 in favor of H1, which states the two populations are not equal at the alpha equals .05…A new drug for pain relief is being tested within a given palliative care population. The new drug is being compared to an already approved pain relief drug that is commonly used in providing palliative care to patients who experience chronic severe pain. Assume the patients are asked to rate the pain on a scale from 1 to 10, and the data presented below was obtained from a small study designed to compare the effectiveness of the two drugs. Set up and interpret the results of a Mann-Whitney U test with an alpha of .05. Pain Rating as Reported by Patients Old Drug 1 3 3 4 6 New Drug 1 2 3 3 7 Old Drug New Drug Total Sample (Ordered Smallest to Largest) Ranks Old Drug New Drug Old Drug New Drug…A new drug for pain relief is being tested within a given palliative care population. The new drug is being compared to an already approved pain relief drug that is commonly used in providing palliative care to patients who experience chronic severe pain. Assume the patients are asked to rate the pain on a scale from 1 to 10, and the data presented below was obtained from a small study designed to compare the effectiveness of the two drugs. Set up and interpret the results of a Mann-Whitney U test with an alpha of .05. Pain Rating as Reported by Patients Old Drug 1 3 3 4 6 New Drug 1 2 3 3 7 Old Drug New Drug Total Sample (Ordered Smallest to Largest) Ranks Old Drug New Drug Old Drug New Drug…
- A new drug for pain relief is being tested within a given palliative care population. The new drug is being compared to an already approved pain relief drug that is commonly used in providing palliative care to patients who experience chronic severe pain. Assume the patients are asked to rate the pain on a scale from 1 to 10, and the data presented below was obtained from a small study designed to compare the effectiveness of the two drugs. Set up and interpret the results of a Mann-Whitney U test with an alpha of .05. Pain Rating as Reported by Patients Old Drug 1 3 3 4 6 New Drug 1 2 3 3 7 A) We fail to reject H0, which states the two populations are equal at the alpha equals .05 level because the calculated Uvalue of 10.5 is greater than the critical U value of 2. B) We fail to reject H0, which states the two populations are equal at the alpha equals .05 level…If the p-value of the chi-square test is __________ than the α (alpha) threshold, we could conclude that the observed relationship is __________ than that expected from Benford’s law. Multiple Choice smaller; smaller greater; greater greater; different smaller; differentThe average farm size in the United States is 444 acres. A random sample of 40 farms in Oregon indicated a mean size of 430 acres, and the population standard deviation is 52 acres. At alpha = 0.05, can it be concluded that the average farm in Oregon differs from the national mean? Use the P-value method.
- The lower quartile (Q1) height for JV players is the same as the ______ for Varsity players.. A new drug for pain relief is being tested within a given palliative care population. The new drug is being compared to an already approved pain relief drug that is commonly used in providing palliative care to patients who experience chronic severe pain. Assume the patients are asked to rate the pain on a scale from 1 to 10, and the data presented below was obtained from a small study designed to compare the effectiveness of the two drugs. Set up and interpret the results of a Mann-Whitney Utest with an alpha of .05. Pain Rating as Reported by Patients Old Drug13346 New Drug12337 Old Drug New Drug Total Sample (Ordered Smallest to Largest) Ranks Old Drug New Drug Old Drug New Drug…A selection of cereals was sampled and the number of calories was plotted against the number of grams of protein with the following results: Parameter Estimates Term Estimate Std. Error Lower 95% Upper 95% Intercept 106.01939 5.687496 94.689284 117.3495 Protein 0.3393214 2.054662 -3.753788 4.4324306 Which of the following is NOT CORRECT? It is estimated that cereals with no protein would have 106 calories/serving. Each additional gram of protein increase the estimated calorie content per serving by .339 calories. The slope is 0.339. Cereals with 5 grams of protein are estimated to have 106.99 calories/serving. The regression line is y-hat = 106.0 + .339(protein)


