Given are five observations for two variables, x and y. xi 2 7 15 18 20 yi 60 51 42 12 14 Use the estimated regression equation: y^=68.5866-2.6441 . a. Compute the mean square error using equation. (to 4 decimals) b. Compute the standard error of the estimate using equation. (to 4 decimals) c. Compute the estimated standard deviation of b1 using equation. (to 4 decimals) d. Use the t-test to test the following hypotheses (a=0.05): Compute the value of the t-test statistic (Enter negative values as negative numbers). (to 3 decimals) What is the p-value? Use Ta


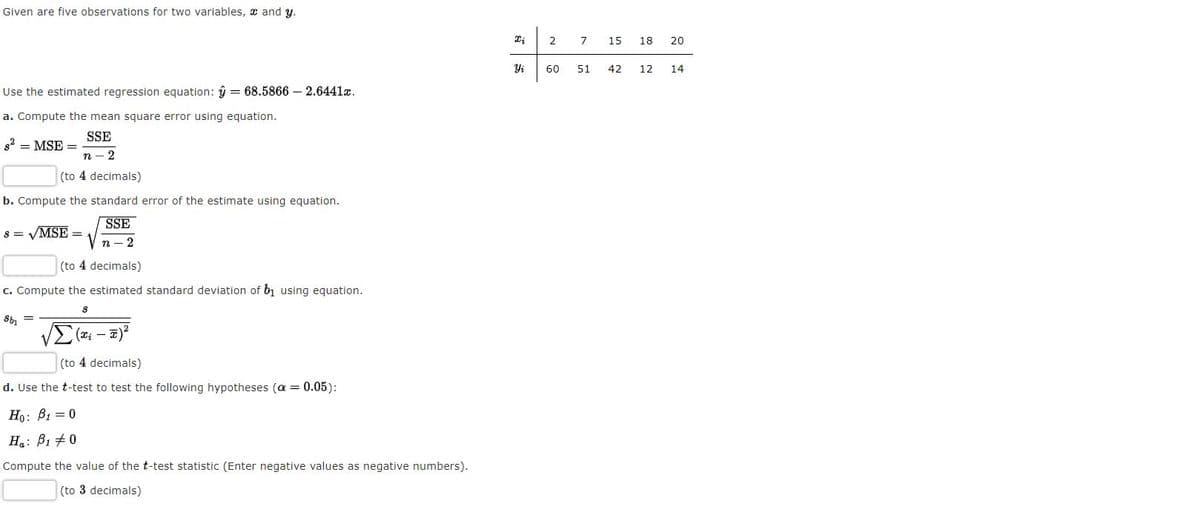
Given are five observations for two variables, x and y.
| xi | 2 | 7 | 15 | 18 | 20 |
| yi | 60 | 51 | 42 | 12 | 14 |
Use the estimated regression equation: y^=68.5866-2.6441 .
a. Compute the mean square error using equation.
(to 4 decimals)
b. Compute the standard error of the estimate using equation.
(to 4 decimals)
c. Compute the estimated standard deviation of b1 using equation.
(to 4 decimals)
d. Use the t-test to test the following hypotheses (a=0.05):
Compute the value of the t-test statistic (Enter negative values as negative numbers).
(to 3 decimals)
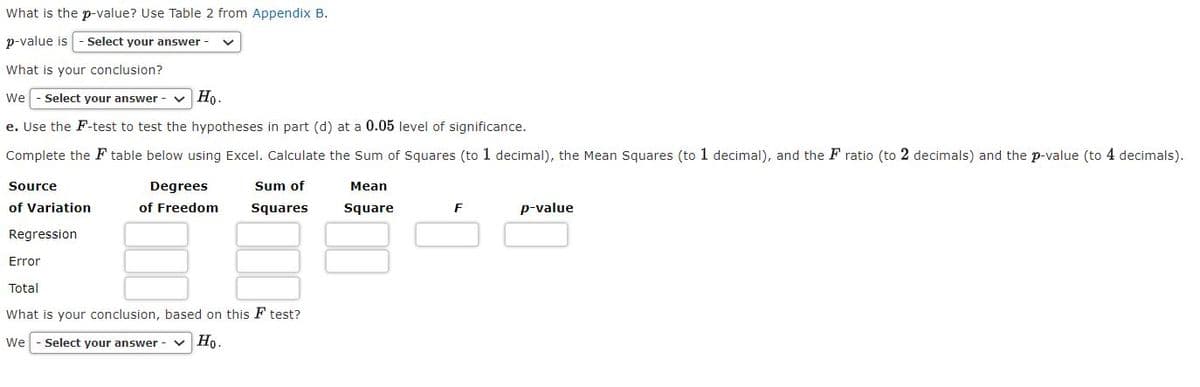
What is the p-value? Use Table 2 from Appendix B.
p-value is
What is your conclusion?
We (do not reject, reject).
e. Use the F-test to test the hypotheses in part (d) at a 0.05 level of significance.
Complete the F table below using Excel. Calculate the Sum of Squares (to 1 decimal), the Mean Squares (to 1 decimal), and the F ratio (to 2 decimals) and the p-value (to 4 decimals).
| Source of Variation |
Degrees of Freedom |
Sum of Squares |
Mean Square |
F | p-value |
| Regression | |||||
| Error | |||||
| Total |
What is your conclusion, based on this F test?
We (do not reject, reject) H0.


Trending now
This is a popular solution!

Step by step
Solved in 2 steps with 2 images


