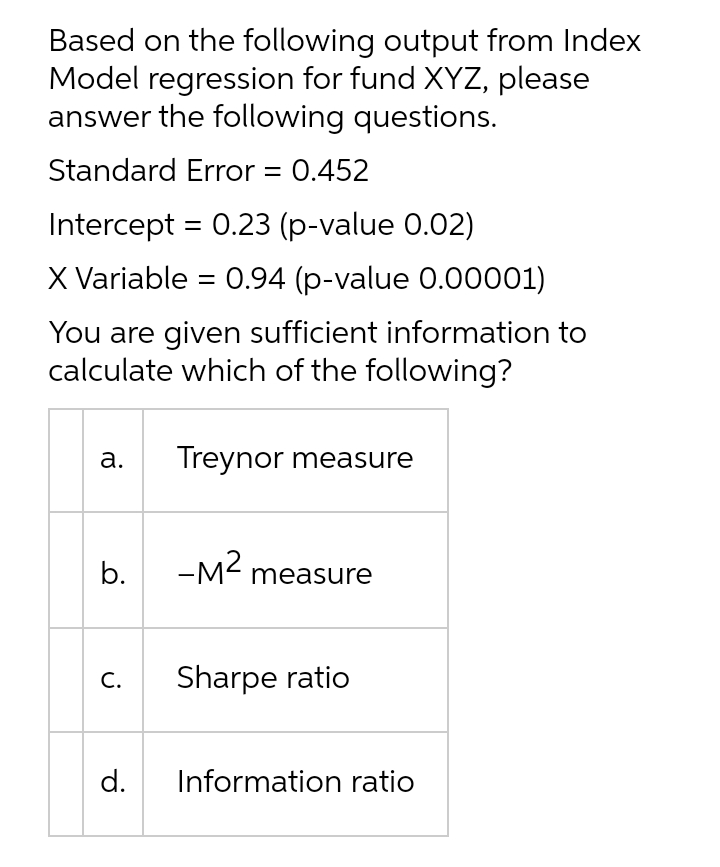
Based on the following output from Index Model regression for fund XYZ, please answer the following questions. Standard Error = 0.452 Intercept = 0.23 (p-value 0.02) X Variable = 0.94 (p-value O.00001) %3D


Q: Fit a linear-regression model relating annual inci- dence of diabetes to time period. (For this…
A: Regression Equation: When we want to predict the value of one variable, say Y, from the given value…
Q: From the given data, calculate the regression equations taking deviation of items
A: From the given data , our aim is to find the regression equation. y=a+bx
Q: If an estimated regression line has a y-intercept of 10 and a slope of -4, then when x= 2, the…
A: The y-intercept of 10 and a slope of -4. That is, a=10,b=-4 The regression line is, y=a+bx=10-4x
Q: The following information is available regarding the total repair costs of Alexander Design Company…
A: 1) Follow the provided steps in excel to find out the required values: Enter data in an excel…
Q: which of the following regressions represents the strongest negative linear relationship between x…
A: The correlation coefficient r is used to measure the linear relationship between two variables X and…
Q: A convenience store recently started to carry a new brand of soft drink. Management is interested in…
A: Given data: .
Q: Step 2: Solve for the following. Slope Interception Simple Linear Regression Equation Standard Error…
A: The following table is considered-
Q: By visual inspection, determine the best-fitting regression model for the scatterplot. y
A:
Q: Based on the regression equation (second image), estimate the CGPA for a student who spends 30…
A: We are given regression equation is y=3.5364+0.0242 X Where y=GPA and x= Hours spend for study
Q: Explain various Assumptions of the Fixed Effects Regression ?
A: The fixed effect principle is that the independent variables are correlated with the…
Q: The owner of Showtime Movie Theaters, Inc., would like to predict weekly gross revenue as a function…
A: Given: n=8
Q: Which one of the following cost estimation methods is the most accurate? Select one: a. The high-low…
A: The range of values of cost estimation and the probability of occurrence of actual cost between two…
Q: Which of the following is(are) TRUE about the simple linear regression model to describe the…
A: Here use relation of slope and correlation coefficient
Q: While attempting to measure its risk exposure for the upcoming year, an insurance company notices a…
A: Regression equation is used to relate the response variable with one or more explanatory variable.…
Q: If a regression equation is used, when are predictions not meaningful?
A: A regression equation is used in statistics to calculate the relationship, which, exists between…
Q: Use a simple linear trend regression (Enrollment = β0 + β1∙Time) to answer the following: Find R2,…
A: Given information: The data represents the values of students registered for Econ 317 in the past 6…
Q: a) Determine the regression equation. b) Estimate the final grade of a student who has a midterm…
A: Given: Student Midterm grade Final grade 1 82 83 2 84 81 3 78 80 4 76 75 5 86 88 6 90…
Q: if an estimated regression line has a y-intercept of 10 and a slope of -4, then when x=2, what is…
A: It is given that, An estimated regression line has y-intercept ,a= 10 Slope,b=-4 Thus,The estimated…
Q: A convenience store recently started to carry a new brand of soft drink. Management is interested in…
A: ii) Given information: Period Sales 1 572 2 618 3 658 4 747 5 643 6 614 7 748 8…
Q: The more concave down the cumulative lift measure over customer buckets, the better the predictive…
A:
Q: in general, how violations of each of the linear regression model assumptions will affect the…
A: It is an important part of statistics . It is widely used .
Q: Explain the curvilinear regression analysis?
A: Curvilinear regression analysis fits curves to data instead of the straight lines you see in linear…
Q: The following data resulted from a study commissioned by a large management consulting company to…
A:
Q: What is measured by the standard error of estimaate for a regression equation?
A: Standard Error of estimate(SEE) is given by, SEE=(Y-Y^)2NY: Actual ValueY^: predicted valuesN:…
Q: The following scatterplot shows a company’s monthly sales, in thousands of dollars, versus monthly…
A: In this case, the data point (x=5.1,y=105) does follow the general trend of the rest of the data.…
Q: According to the regression equation, for a student who gets 85 on the midterm (one standard…
A: For midterm, it is given that Mean1 = 75, SD1 = 10 For final, it is given that Mean2 = 75, SD2 = 10…
Q: In a linear regression analysis with the usual assumptions, which one of the following quantities is…
A: In linear regression analysis, the quantities are given by μy , σe, ei and predicted response…
Q: Which of the following is the regression equation at the 1% meaning level according to the Minitab…
A: The coefficient that are significant at 0.01 level of significance is those coefficients with…
Q: Answer the following questions using the SPSS regression analysis OUTPUT (given below): a. From the…
A: 3. a. From the SPSS output, the intercept is 76.960, and the slope is -4.495. The estimated…
Q: The following demand function for a price-setting firm selling good X was estimated using standard…
A: From the estimation results, the regression equation is Q = 450 – 10P + 0.2M – 6.2PR
Q: The y-intercept and slope coefficient of the x-variable are 0.013 and .892, respectively. If the…
A:
Q: Connie Harris, who is in charge of office supplies at First Capital Mortgage Corp., would like to…
A: The estimated regression equation for this data set is found using Excel and the procedure is shown…
Q: Consider the following production function:
A: Given information: The regression output is given.
Q: he admissions officer for Clearwater College developed the following estimated regression equation…
A: Given Information: The admissions officer for Clearwater college developed the following estimated…
Q: accurately predict my diastolic blood pressure? accurately (h) For what range of systolic blood…
A: Regression analysis is one of the strongest concept in statistics which is used to find the form of…
Q: A value of r close to _____ indicates that the regression equation is extremely useful for making…
A: Correlation: Correlation a measure which indicates the “go-togetherness” of two data sets. It can be…
Q: For the regression equation, Ŷ = –2X + 6, if the X value is above the mean (positive deviation),…
A: We have to find correct statement for y.
Q: Define a qualitative regression model for a survey question where four gender options have been…
A: From the given information, It is required to construct qualitative regression model for a survey…
Q: Illustrate the Regression Discontinuity Estimators?
A: In the context of an evaluation study, the Regression discontinuity design is characterized by a…
Q: (a) Without using any software, construct a simple linear regression model for the above data. (b)…
A:
Q: Using the regression model from the previous problem, what is the interpretation of the slope…
A: The regression equation is, y= 93.51214 -0.23858 *Age - 12.79024* GPA+ 1.32088*Gender_num The slope…
Q: Are boys, on average, heavier than girls at birth, all other factors being equal? If so, by how…
A: The given regression model estimates the weight of new born babies on the basis of factors affecting…
Q: Using the regression line, we predict the final score of a student with a midterm score of 70 to be…
A:
Q: In a simple linear regression you are told that the estimate of the slope coefficient was 0.9 and…
A: Given, t-statistic = -3.6 Testing whether slope parameter = 1 or not Estimated slope coefficient =…
Q: Suppose you wanted to test whether or not the payoff to an additional year of education was the same…
A: We want to test whether the pay-off for an additional year of education was same for mean and women…
Q: Develop the estimated regression equation that could be used to predict the percentage of games won…
A: In this case Yards/Attempt (x) is the independent variable and WinPct (y) is the dependent variable.…
Q: Step 2 of 2: Determine if a statistically significant linear relationship exists between the…
A:


Trending now
This is a popular solution!

Step by step
Solved in 2 steps

- Olympic Pole Vault The graph in Figure 7 indicates that in recent years the winning Olympic men’s pole vault height has fallen below the value predicted by the regression line in Example 2. This might have occurred because when the pole vault was a new event there was much room for improvement in vaulters’ performances, whereas now even the best training can produce only incremental advances. Let’s see whether concentrating on more recent results gives a better predictor of future records. (a) Use the data in Table 2 (page 176) to complete the table of winning pole vault heights shown in the margin. (Note that we are using x=0 to correspond to the year 1972, where this restricted data set begins.) (b) Find the regression line for the data in part ‚(a). (c) Plot the data and the regression line on the same axes. Does the regression line seem to provide a good model for the data? (d) What does the regression line predict as the winning pole vault height for the 2012 Olympics? Compare this predicted value to the actual 2012 winning height of 5.97 m, as described on page 177. Has this new regression line provided a better prediction than the line in Example 2?For the following exercises, use Table 4 which shows the percent of unemployed persons 25 years or older who are college graduates in a particular city, by year. Based on the set of data given in Table 5, calculate the regression line using a calculator or other technology tool, and determine the correlation coefficient. Round to three decimal places of accuracyConsider the following hypothetical regression, with FAIL? as a dummy variable for if a business failed in its first year (1=failed, 0=didn’t fail); LOAN is how much money, in thousands of dollars, the business got as a loan when it started; GIG? is a dummy variable for if there was a gig economy job available, such as driving for Lyft (1=available, 0=not available), and COMP is the number of existing competitors the business faced when it started. All variables are statistically significant. FAIL? = 0.63 – 0.01*LOAN – 0.08*GIG? + 0.05*COMP Answer the following: Determine the predicted value of FAIL? if the business had a $30,000 loan, there was no gig economy, and four competitors. In everyday language, what does the estimated value found in A mean? If a business gets an additional six thousand dollars in loans, how would FAIL? change? Give the “punchline” interpretation of the COMP variable: “For every additional competitor…”
- A sociologist was hired by a large city hospital to investigate the relationship between the number of unauthorized days that employees are absent per year and the distance (miles) between home and work for the employee. A sample of 10 employees was chosen, and the following data were collected. A. Is the estimated regression equation appropriate and adequateFor the simple regression equation (a), conduct an individual significance tests at the 5% significance level to determine if SQFT is a significant predictor of Price. (Check photo for data)In the following model, "employed" is a dummy indicating a person is employed: donation = B + B edu + Bemployed + uT Running this model will produce the same results of differential in donation between employed people and unemployed people as running two separate regressions for employed people and unemployed people. A. True B. False
- Using the regression line attached. Based on only the above plot, one can conclude: a) height causes an increase in weight b) weight causes an increase in height c) taller people are more likely to weigh more than shorter people, at least in the sample on which this data is based d) a statistically significant predictive relationship between height and weight e) c and dSuppose the following data were collected relating the selling price of a house to square footage and whether or not the house is made out of brick. Use statistical software to find the regression equation. Is there enough evidence to support the claim that on average brick houses are more expensive than other types of houses at the 0.010.01 level of significance? If yes, type the regression equation in the spaces provided with answers rounded to two decimal places. Else, select "There is not enough evidence." Price Sqft Brick (1 if brick, 0 if otherwise 241255 3392 0 184518 2038 1 176488 1906 0 240068 3329 0 169760 1828 0 185335 2081 0 172735 1926 0 224281 3425 0 172589 1676 1 214635 2735 1 199666 2373 1 208348 2662 1 218360 2834 1 230160 3254 0 164812 1431 0 191560 1839 1 203255 2456 1 173325 1530 0 168073 1381 1 179620 1457 1 Selecting a checkbox will replace the entered answer value(s) with the checkbox value.…Which of the following is not a plot of residuals typically used in multiple regression analysis?Select one:a. None of these b. Residuals versus correlation coefficients..c. Residuals versus X1.d. Residuals versus timee. Residuals versus X2.
- Note:- please answer question B. using the blow information and image. 10. Using a sample of 546 observations, a researcher is interested infinding factors that influence house prices (measured in tenthousands). The researcher run regression of Hedonic price modelthat explain house prices using lot size, bed rooms, bath rooms,stories all are measured in number of units and dummy variables 2whether the house has air-conditioning, drive way, recreation room,glass show , full basement, garage place and preferred area the resultsare shown below.A researcher notes that, in a certain region, a disproportionate number of software millionaires were born around the year 1955. Is this a coincidence, or does birth year matter when gauging whether a software founder will besuccessful? The researcher investigated this question by analyzing the data shown in the accompanying table. Complete parts a through c below. a. Find the coefficient of determination for the simple linear regression model relating number (y) of software millionaire birthdays in a decade to total number (x) of births in the region. Interpret the result. The coefficient of determination is 1.___? (Round to three decimal places as needed.) This value indicates that 2.____ of the sample variation in the number of software millionaire birthdays is explained by the linear relationship with the total number of births in the region. (Round to one decimal place as needed.) b. Find the coefficient of determination for the simple linear regression model…The Mayor of texas whom is partners with a local agriculturalist wants to know how the amount of fertilizer and the amount of water given to plants affect their growth. The results were inputted into MINITAB so as to fit the model a) Write out the regression equation b) What is the sample size used in this investigation? c) Determine the values of *, ** and ***, **** d) Conduct a hypothesis test, at the 5% level of significance, to determine whether ? is significant. e) What would be the growth of the plant if 4g of fertilizer and 7g of ater was given to it daily? f) Carry out an F -test at the 1% significance level to determine whether the model is significant


