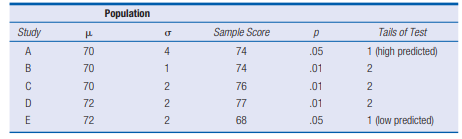
Based on the information given for each of the following studies, decide whether to reject the null hypothesis. For each, give (a) the Z-score cutoff (or cutoffs) on the comparison distribution at which the null hypothesis should be rejected, (b) the Z score on the comparison distribution for the sample score, and (c) your conclusion. Assume that all populations are normally distributed
Based on the information given for each of the following studies, decide whether to reject the null hypothesis. For each, give (a) the Z-score cutoff (or cutoffs) on the comparison distribution at which the null hypothesis should be rejected, (b) the Z score on the comparison distribution for the sample score, and (c) your conclusion. Assume that all populations are normally distributed

MATLAB: An Introduction with Applications
6th Edition
ISBN:9781119256830
Author:Amos Gilat
Publisher:Amos Gilat
Chapter1: Starting With Matlab
Section: Chapter Questions
Problem 1P

Related questions
Question
Based on the information given for each of the following studies, decide whether to reject the null hypothesis. For each, give
(a) the Z-score cutoff (or cutoffs) on the comparison distribution at which the null hypothesis should be rejected,
(b) the Z score on the comparison distribution for the sample score, and
(c) your conclusion. Assume that all populations are
Transcribed Image Text:Study
A
B
C
D
E
ERRONN
70
70
70
72
72
Population
σ
4
1
2
NN
2
2
Sample Score
74
74
76
77
68
P
.05
.01
.01
.01
.05
Tails of Test
1 (high predicted)
2
2
2
1 (low predicted)
Expert Solution
This question has been solved!
Explore an expertly crafted, step-by-step solution for a thorough understanding of key concepts.

Step by step
Solved in 4 steps with 5 images

Recommended textbooks for you
MATLAB: An Introduction with Applications
Statistics
ISBN:
9781119256830
Author:
Amos Gilat
Publisher:
John Wiley & Sons Inc

Probability and Statistics for Engineering and th…
Statistics
ISBN:
9781305251809
Author:
Jay L. Devore
Publisher:
Cengage Learning

Statistics for The Behavioral Sciences (MindTap C…
Statistics
ISBN:
9781305504912
Author:
Frederick J Gravetter, Larry B. Wallnau
Publisher:
Cengage Learning
MATLAB: An Introduction with Applications
Statistics
ISBN:
9781119256830
Author:
Amos Gilat
Publisher:
John Wiley & Sons Inc
Probability and Statistics for Engineering and th…
Statistics
ISBN:
9781305251809
Author:
Jay L. Devore
Publisher:
Cengage Learning
Statistics for The Behavioral Sciences (MindTap C…
Statistics
ISBN:
9781305504912
Author:
Frederick J Gravetter, Larry B. Wallnau
Publisher:
Cengage Learning

Elementary Statistics: Picturing the World (7th E…
Statistics
ISBN:
9780134683416
Author:
Ron Larson, Betsy Farber
Publisher:
PEARSON

The Basic Practice of Statistics
Statistics
ISBN:
9781319042578
Author:
David S. Moore, William I. Notz, Michael A. Fligner
Publisher:
W. H. Freeman

Introduction to the Practice of Statistics
Statistics
ISBN:
9781319013387
Author:
David S. Moore, George P. McCabe, Bruce A. Craig
Publisher:
W. H. Freeman