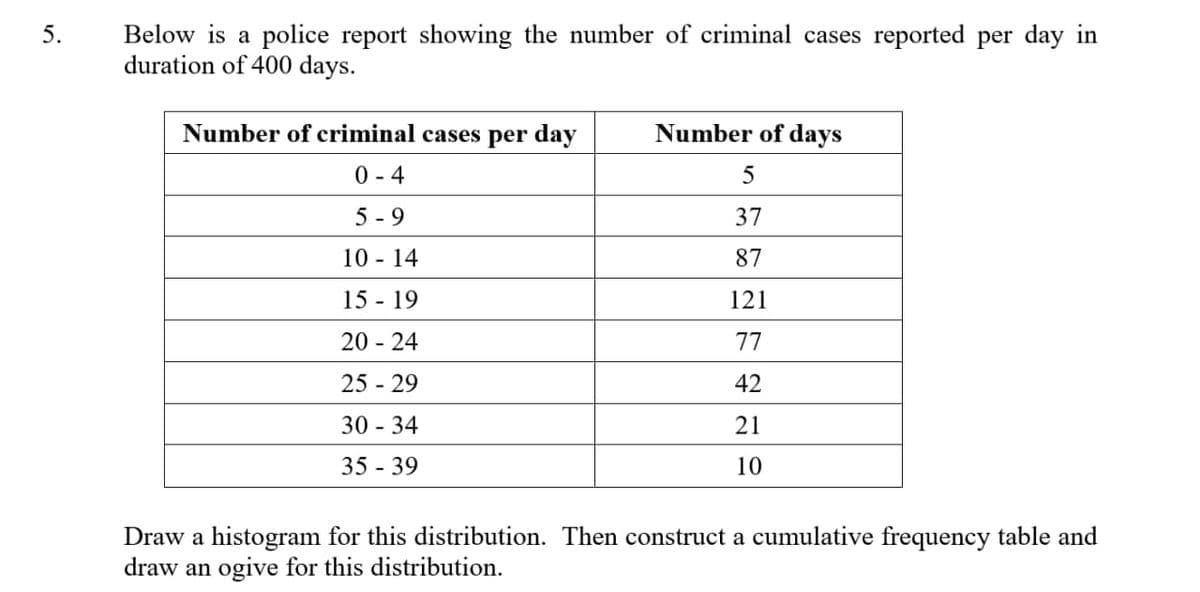
Below is a police report showing the number of criminal cases reported per day in duration of 400 days. 5. Number of criminal cases per day Number of days 0- 4 5 5 - 9 37 10 - 14 87 15 - 19 121 20 - 24 77 25 - 29 42 30 - 34 21 35 - 39 10 Draw a histogram for this distribution. Then construct a cumulative frequency table and draw an ogive for this distribution.
Below is a police report showing the number of criminal cases reported per day in duration of 400 days. 5. Number of criminal cases per day Number of days 0- 4 5 5 - 9 37 10 - 14 87 15 - 19 121 20 - 24 77 25 - 29 42 30 - 34 21 35 - 39 10 Draw a histogram for this distribution. Then construct a cumulative frequency table and draw an ogive for this distribution.

Glencoe Algebra 1, Student Edition, 9780079039897, 0079039898, 2018
18th Edition
ISBN:9780079039897
Author:Carter
Publisher:Carter
Chapter10: Statistics
Section10.4: Distributions Of Data
Problem 19PFA

Related questions
Question
PLEASE PROVIDE ANSWER WITH EXPLANATION FOR BOTH
Transcribed Image Text:Below is a police report showing the number of criminal cases reported per day in
duration of 400 days.
5.
Number of criminal cases per day
Number of days
0 - 4
5
5 - 9
37
10 - 14
87
15 - 19
121
20 - 24
77
25 - 29
42
30 - 34
21
35 - 39
10
Draw a histogram for this distribution. Then construct a cumulative frequency table and
draw an ogive for this distribution.
Expert Solution
This question has been solved!
Explore an expertly crafted, step-by-step solution for a thorough understanding of key concepts.

Step by step
Solved in 3 steps with 3 images

Recommended textbooks for you
Glencoe Algebra 1, Student Edition, 9780079039897…
Algebra
ISBN:
9780079039897
Author:
Carter
Publisher:
McGraw Hill

Mathematics For Machine Technology
Advanced Math
ISBN:
9781337798310
Author:
Peterson, John.
Publisher:
Cengage Learning,
Glencoe Algebra 1, Student Edition, 9780079039897…
Algebra
ISBN:
9780079039897
Author:
Carter
Publisher:
McGraw Hill
Mathematics For Machine Technology
Advanced Math
ISBN:
9781337798310
Author:
Peterson, John.
Publisher:
Cengage Learning,