Binge-watching a television show might not be the best way to enjoy a television series (Horvath, Horton, Lodge, & Hattie, 2017). Participants who binge-watched a television series enjoyed the show less than participants who watched the series in daily sessions. In the study, one group watched the complete television series in a single session and the other group watched the show in daily, one-hour sessions. After watching the series, each group rated their enjoyment of the series on a scale of 0-100. Data like those observed by the authors are listed below. IT Binge-watched Daily-watched 87 84 71 100 73 87 86 97 78 92 Convert the data from this problem into a form suitable for the point-biserial correlation (use 1 for the binge-watching participants and 0 for participants who watched the show in daily sessions), and then compute the correlation. ΣΧ ΣΥ ΣΧΥ SSx SSy SP Square the value of the point-biserial correlation to obtain r2. r2 = An independent-samples t test for the difference between the means of the two groups produced t = -2.94 with df = 8. Use the equation to compute the value of r2 directly from the t statistic and its df. r2 = Within rounding error, this value of r2 should be equal to the value obtained from the point-biserial correlation.
Binge-watching a television show might not be the best way to enjoy a television series (Horvath, Horton, Lodge, & Hattie, 2017). Participants who binge-watched a television series enjoyed the show less than participants who watched the series in daily sessions. In the study, one group watched the complete television series in a single session and the other group watched the show in daily, one-hour sessions. After watching the series, each group rated their enjoyment of the series on a scale of 0-100. Data like those observed by the authors are listed below. IT Binge-watched Daily-watched 87 84 71 100 73 87 86 97 78 92 Convert the data from this problem into a form suitable for the point-biserial correlation (use 1 for the binge-watching participants and 0 for participants who watched the show in daily sessions), and then compute the correlation. ΣΧ ΣΥ ΣΧΥ SSx SSy SP Square the value of the point-biserial correlation to obtain r2. r2 = An independent-samples t test for the difference between the means of the two groups produced t = -2.94 with df = 8. Use the equation to compute the value of r2 directly from the t statistic and its df. r2 = Within rounding error, this value of r2 should be equal to the value obtained from the point-biserial correlation.

Glencoe Algebra 1, Student Edition, 9780079039897, 0079039898, 2018
18th Edition
ISBN:9780079039897
Author:Carter
Publisher:Carter
Chapter10: Statistics
Section10.6: Summarizing Categorical Data
Problem 13CYU

Related questions
Question
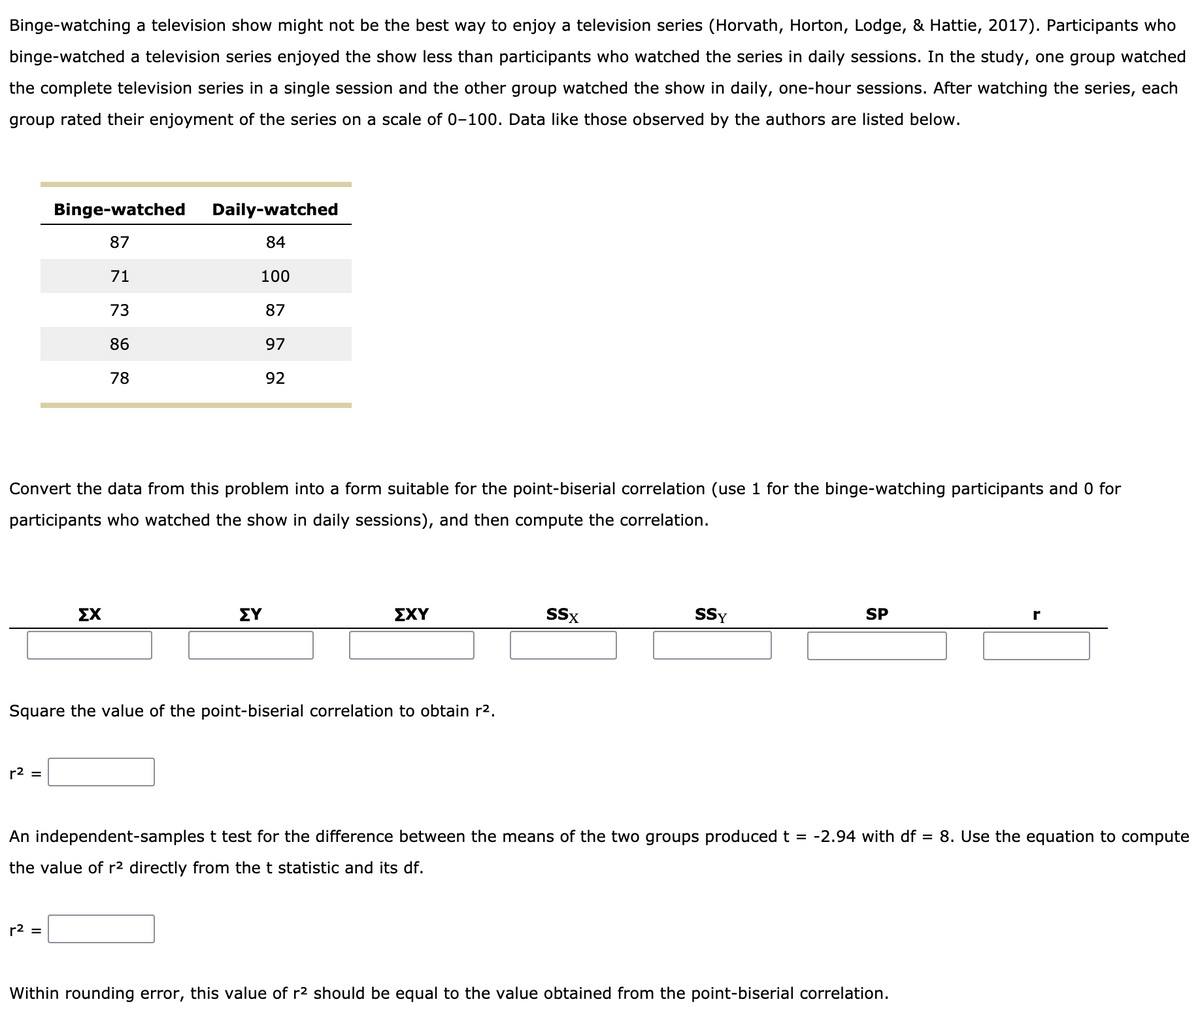
Transcribed Image Text:Binge-watching a television show might not be the best way to enjoy a television series (Horvath, Horton, Lodge, & Hattie, 2017). Participants who
binge-watched a television series enjoyed the show less than participants who watched the series in daily sessions. In the study, one group watched
the complete television series in a single session and the other group watched the show in daily, one-hour sessions. After watching the series, each
group rated their enjoyment of the series on a scale of 0-100. Data like those observed by the authors are listed below.
Binge-watched
Daily-watched
87
84
71
100
73
87
86
97
78
92
Convert the data from this problem into a form suitable for the point-biserial correlation (use 1 for the binge-watching participants and 0 for
participants who watched the show in daily sessions), and then compute the correlation.
ΣΧ
ΣΥ
ΣΧΥ
SSx
SSy
SP
Square the value of the point-biserial correlation to obtain r2.
r2 =
An independent-samples t test for the difference between the means of the two groups produced t = -2.94 with df = 8. Use the equation to compute
the value of r2 directly from the t statistic and its df.
r2 =
Within rounding error, this value of r2 should be equal to the value obtained from the point-biserial correlation.
Expert Solution
This question has been solved!
Explore an expertly crafted, step-by-step solution for a thorough understanding of key concepts.

This is a popular solution!

Trending now
This is a popular solution!

Step by step
Solved in 4 steps

Recommended textbooks for you
Glencoe Algebra 1, Student Edition, 9780079039897…
Algebra
ISBN:
9780079039897
Author:
Carter
Publisher:
McGraw Hill

Big Ideas Math A Bridge To Success Algebra 1: Stu…
Algebra
ISBN:
9781680331141
Author:
HOUGHTON MIFFLIN HARCOURT
Publisher:
Houghton Mifflin Harcourt

Holt Mcdougal Larson Pre-algebra: Student Edition…
Algebra
ISBN:
9780547587776
Author:
HOLT MCDOUGAL
Publisher:
HOLT MCDOUGAL
Glencoe Algebra 1, Student Edition, 9780079039897…
Algebra
ISBN:
9780079039897
Author:
Carter
Publisher:
McGraw Hill
Big Ideas Math A Bridge To Success Algebra 1: Stu…
Algebra
ISBN:
9781680331141
Author:
HOUGHTON MIFFLIN HARCOURT
Publisher:
Houghton Mifflin Harcourt
Holt Mcdougal Larson Pre-algebra: Student Edition…
Algebra
ISBN:
9780547587776
Author:
HOLT MCDOUGAL
Publisher:
HOLT MCDOUGAL