Sleep apnea is a disorder characterized by pauses in breathing during sleep. Children who sufer from untreated sleep apnea often have behavior problems, induding hyperactivity, inattention, and aggression. A common treatment for pediatric sleep apnea is the surgical removal of enlarged tonsils and adenoids that are obstructing the airways. Suppose researchers at a sleep clinic are interested in the effect of surgical treatment for pediatric sleep apnea on hyperactive behavior. They study nine children without sleep apnea, nine children with untreated sleep apnea, and nine children who have been surgically treated for sleep apnea. Hyperactivity is measured using the Conners Rating Scales. The sample means and sums of squares of the scores for each of the three groups are presented in the following table. Group Sample Mean Sum of Squares No Sleep Apnea 0.27 0.1568 Untreated Sleep Apnea 0.54 0.2592 Treated Sleep Apnea 0.32 0.1800 The researchers perform an analysis of variance (ANOVA) at a = 0.01 to test the hypothesis that the treatment means are equal. The results are presented in the following ANOVA table. ANOVA Table Source of Variation Sum of Squares Degrees of Freedom Mean Square Between Treatments 0.3714 2 0.1857 7.49 WIRhin Treatments 0.5960 24 0.0248 Total 0.9674 26 The ANOVA yielded a significant F statistic, so the nul hypothesis is rejected. Since there are more than two groups, the researchers are interested in determining which groups are different. The Tukey's Honestly Significant Difference (HSD) test will be used to evaluate the pairs. First, use the table given below to determine the appropriate value of q at a = 0.01. The q value for this problem is The Studentized Range Statistic (q) df for Error Term 2
Sleep apnea is a disorder characterized by pauses in breathing during sleep. Children who sufer from untreated sleep apnea often have behavior problems, induding hyperactivity, inattention, and aggression. A common treatment for pediatric sleep apnea is the surgical removal of enlarged tonsils and adenoids that are obstructing the airways. Suppose researchers at a sleep clinic are interested in the effect of surgical treatment for pediatric sleep apnea on hyperactive behavior. They study nine children without sleep apnea, nine children with untreated sleep apnea, and nine children who have been surgically treated for sleep apnea. Hyperactivity is measured using the Conners Rating Scales. The sample means and sums of squares of the scores for each of the three groups are presented in the following table. Group Sample Mean Sum of Squares No Sleep Apnea 0.27 0.1568 Untreated Sleep Apnea 0.54 0.2592 Treated Sleep Apnea 0.32 0.1800 The researchers perform an analysis of variance (ANOVA) at a = 0.01 to test the hypothesis that the treatment means are equal. The results are presented in the following ANOVA table. ANOVA Table Source of Variation Sum of Squares Degrees of Freedom Mean Square Between Treatments 0.3714 2 0.1857 7.49 WIRhin Treatments 0.5960 24 0.0248 Total 0.9674 26 The ANOVA yielded a significant F statistic, so the nul hypothesis is rejected. Since there are more than two groups, the researchers are interested in determining which groups are different. The Tukey's Honestly Significant Difference (HSD) test will be used to evaluate the pairs. First, use the table given below to determine the appropriate value of q at a = 0.01. The q value for this problem is The Studentized Range Statistic (q) df for Error Term 2

MATLAB: An Introduction with Applications
6th Edition
ISBN:9781119256830
Author:Amos Gilat
Publisher:Amos Gilat
Chapter1: Starting With Matlab
Section: Chapter Questions
Problem 1P

Related questions
Question
fill all blanks.
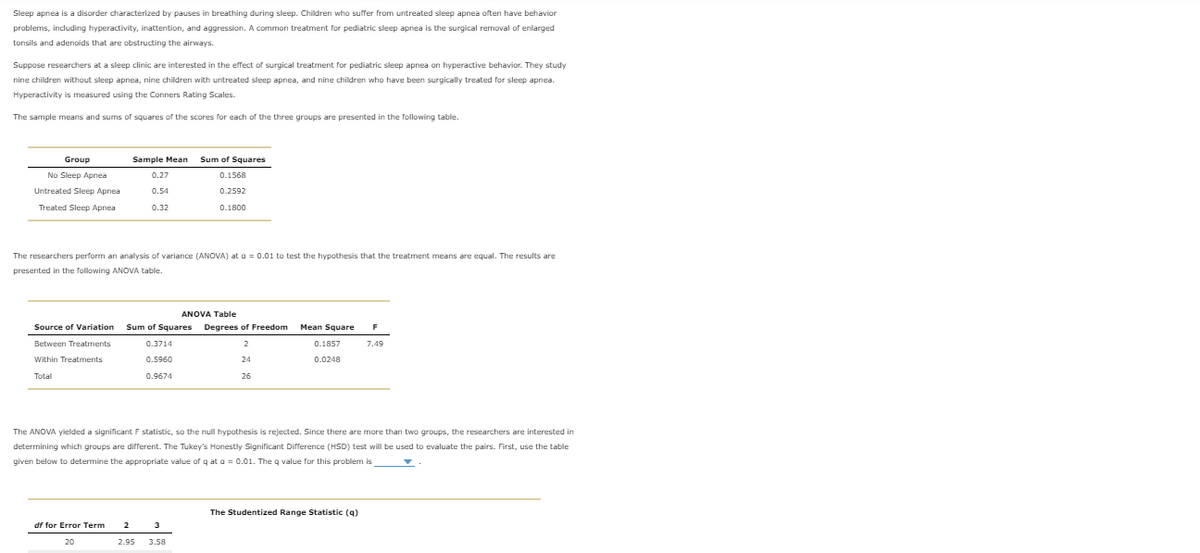
Transcribed Image Text:Sleep apnea is a disorder characterized by pauses in breathing during sleep. Children who suffer from untreated sleep apnea often have behavior
problems, including hyperactivity, inattention, and aggression. A common treatment for pediatric sleep apnea is the surgical removal
enlarged
tonsils and adenoids that are obstructing the airways.
Suppose researchers at a sleep clinic are interested in the effect of surgical treatment for pediatric sleep apnea on hyperactive behavior. They study
nine children without sleep apnea, nine children with untreated sleep apnea, and nine children who have been surgically treated for sleep apnea.
Hyperactivity is measured using the Conners Rating Scales.
The sample means and sums of squares of the scores for each of the three groups are presented in the following table.
Group
Sample Mean
Sum of Squares
No Sleep Apnea
0.27
0.1568
Untreated Sleep Apnea
0.54
0.2592
Treated Sleep Apnea
0.32
0.1800
The researchers perform an analysis of variance (ANOVA) at a = 0.01 to test the hypothesis that the treatment means are equal. The results are
presented in the following ANOVA table.
ANOVA Table
Source of Variation
Sum of Squares Degrees of Freedom
Mean Square
Between Treatments
0.3714
2
0.1857
7.49
Within Treatments
0.5960
24
0.0248
Total
0.9674
26
The ANOVA yielded a significant F statistic, so the null hypothesis is rejected. Since there are more than two groups, the researchers are interested in
determining which groups are different. The Tukey's Honestly Significant Difference (HSD) test will be used to evaluate the pairs. First, use the table
given below to determine the appropriate value of q at a = 0.01. The q value for this problem is
The Studentized Range Statistic (q)
df for Error Term
2
3
20
2.95
3.58
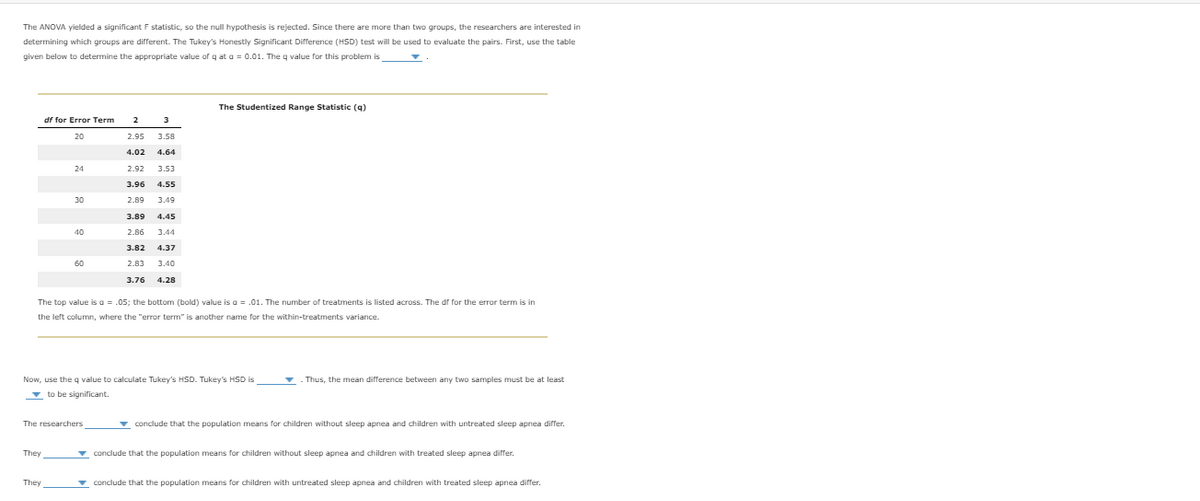
Transcribed Image Text:The ANOVA yielded a significant F statistic, so the null hypothesis is rejected. Since there are more than two groups, the researchers are interested in
determining which groups are difrrerent. The Tukey's Honestly Significant Difference (HSD) test will be used to evaluate the pairs. First, use the table
given below to determine the appropriate value of g at a = 0.01. The g value for this problem is
The Studentized Range Statistic (q)
df for Error Term
2
3
20
2.95
3.58
4.02
4.64
24
2.92
3.53
3.96
4.55
30
2.89
3.49
3.89
4.45
40
2.86
3.44
3.82
4.37
60
2.83
3.40
3.76
4.28
The top value is a = .05; the bottom (bold) value is a = .01. The number of treatments is listed across. The df for the error term is in
the left column, where the "error term" is another name for the within-treatments variance.
Now, use the q value to calculate Tukey's HSD. Tukey's HSD is
Thus, the mean difference between any two samples must be at least
- to be significant.
The researchers
- conclude that the population means for children without sleep apnea and children with untreated sleep apnea differ.
They
conclude that the population means for children without sleep apnea and children with treated sleep apnea differ.
They
conclude that the population means for children with untreated sleep apnea and children with treated sleep apnea differ.
Expert Solution
This question has been solved!
Explore an expertly crafted, step-by-step solution for a thorough understanding of key concepts.

This is a popular solution!

Trending now
This is a popular solution!

Step by step
Solved in 2 steps with 2 images

Recommended textbooks for you
MATLAB: An Introduction with Applications
Statistics
ISBN:
9781119256830
Author:
Amos Gilat
Publisher:
John Wiley & Sons Inc

Probability and Statistics for Engineering and th…
Statistics
ISBN:
9781305251809
Author:
Jay L. Devore
Publisher:
Cengage Learning

Statistics for The Behavioral Sciences (MindTap C…
Statistics
ISBN:
9781305504912
Author:
Frederick J Gravetter, Larry B. Wallnau
Publisher:
Cengage Learning
MATLAB: An Introduction with Applications
Statistics
ISBN:
9781119256830
Author:
Amos Gilat
Publisher:
John Wiley & Sons Inc
Probability and Statistics for Engineering and th…
Statistics
ISBN:
9781305251809
Author:
Jay L. Devore
Publisher:
Cengage Learning
Statistics for The Behavioral Sciences (MindTap C…
Statistics
ISBN:
9781305504912
Author:
Frederick J Gravetter, Larry B. Wallnau
Publisher:
Cengage Learning

Elementary Statistics: Picturing the World (7th E…
Statistics
ISBN:
9780134683416
Author:
Ron Larson, Betsy Farber
Publisher:
PEARSON

The Basic Practice of Statistics
Statistics
ISBN:
9781319042578
Author:
David S. Moore, William I. Notz, Michael A. Fligner
Publisher:
W. H. Freeman

Introduction to the Practice of Statistics
Statistics
ISBN:
9781319013387
Author:
David S. Moore, George P. McCabe, Bruce A. Craig
Publisher:
W. H. Freeman