Body Mass Index (BMI) is the ratio of a person's body weight to volume. Extreme high values are associated with obesity, and extreme low values are associated with malnutrition. The Centers for Discase Control (CDC) uses percentiles, rather than fixed cutoffs, to categorize the weight status of individuals. Percentiles convey information about a person's relative standing over time in relation to others of the same age and gender. The CDC uses the table below to classify children from ages 2 to 20. Weight status Percentile range Underweight Less than the 5th percentile 5th percentile to less than the 85th percentile 85th to less than the 95th percentile Healthy weight Overweight Obese Equal to or greater than the 95th percentile One of the following statements is true. Select the true statement. More than 5% of all people are underweight. O Approximately 95% of all people are underweight. O Approximately 5% of all people are underweight. More people are underweight than are overweight. O Approximately the same number of people are overweight as are underweight.
Body Mass Index (BMI) is the ratio of a person's body weight to volume. Extreme high values are associated with obesity, and extreme low values are associated with malnutrition. The Centers for Discase Control (CDC) uses percentiles, rather than fixed cutoffs, to categorize the weight status of individuals. Percentiles convey information about a person's relative standing over time in relation to others of the same age and gender. The CDC uses the table below to classify children from ages 2 to 20. Weight status Percentile range Underweight Less than the 5th percentile 5th percentile to less than the 85th percentile 85th to less than the 95th percentile Healthy weight Overweight Obese Equal to or greater than the 95th percentile One of the following statements is true. Select the true statement. More than 5% of all people are underweight. O Approximately 95% of all people are underweight. O Approximately 5% of all people are underweight. More people are underweight than are overweight. O Approximately the same number of people are overweight as are underweight.

Linear Algebra: A Modern Introduction
4th Edition
ISBN:9781285463247
Author:David Poole
Publisher:David Poole
Chapter4: Eigenvalues And Eigenvectors
Section4.6: Applications And The Perron-frobenius Theorem
Problem 22EQ

Related questions
Question
One of the following statements is true. Select the true statement.
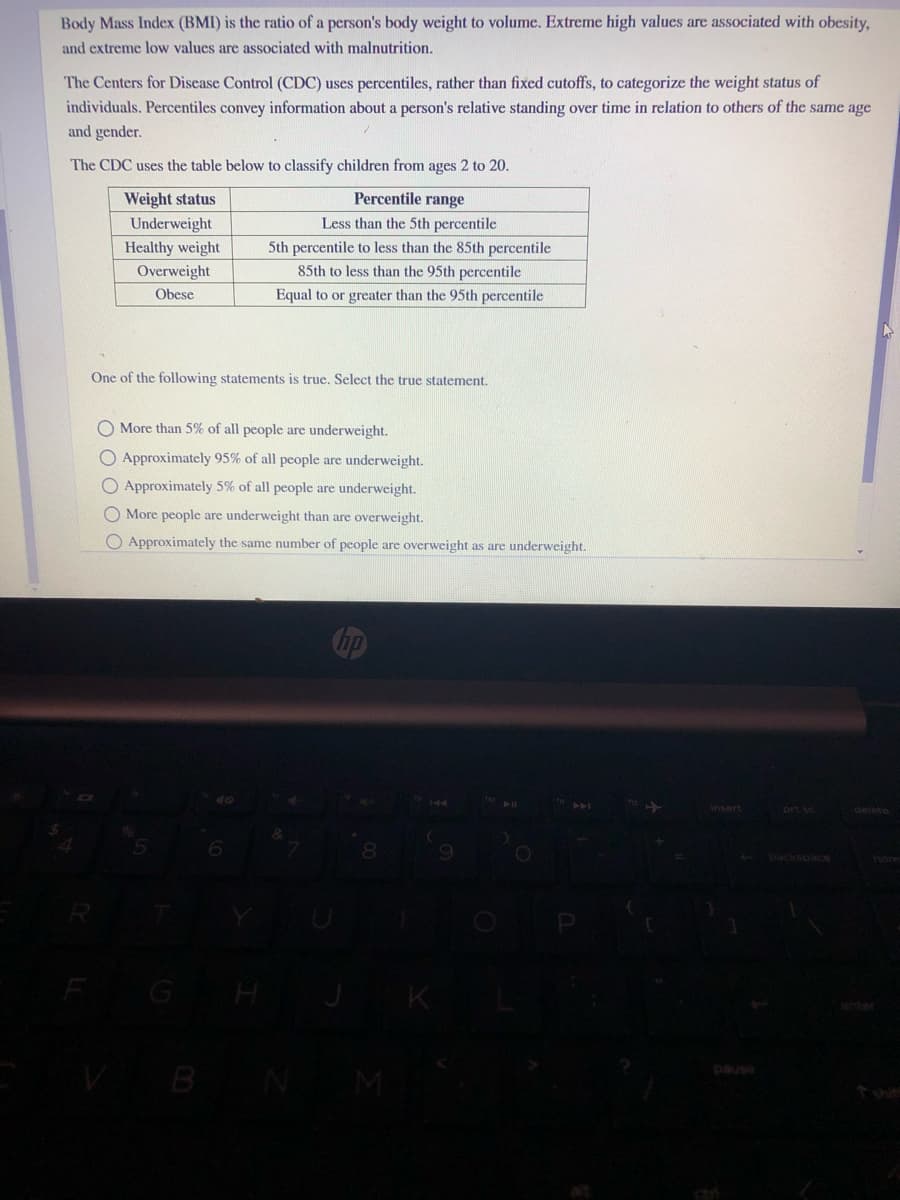
Transcribed Image Text:Body Mass Index (BMI) is the ratio of a person's body weight to volume. Extreme high values are associated with obesity,
and extreme low values are associated with malnutrition.
The Centers for Disease Control (CDC) uses percentiles, rather than fixed cutoffs, to categorize the weight status of
individuals. Percentiles convey information about a person's relative standing over time in relation to others of the same age
and gender.
The CDC uses the table below to classify children from ages 2 to 20.
Percentile range
Weight status
Underweight
Less than the 5th percentile
5th percentile to less than the 85th percentile
85th to less than the 95th percentile
Healthy weight
Overweight
Obese
Equal to or greater than the 95th percentile
One of the following statements is true. Select the true statement.
O More than 5% of all people are underweight.
O Approximately 95% of all people are underweight.
OApproximately 5% of all people are underweight.
O More people are underweight than are overweight.
O Approximately the same number of people are overweight as are underweight.
prt se
delete
backspace
GH
B N
pause
Expert Solution
This question has been solved!
Explore an expertly crafted, step-by-step solution for a thorough understanding of key concepts.

This is a popular solution!

Trending now
This is a popular solution!

Step by step
Solved in 2 steps

Knowledge Booster


Learn more about
Need a deep-dive on the concept behind this application? Look no further. Learn more about this topic, statistics and related others by exploring similar questions and additional content below.Recommended textbooks for you
Linear Algebra: A Modern Introduction
Algebra
ISBN:
9781285463247
Author:
David Poole
Publisher:
Cengage Learning


Glencoe Algebra 1, Student Edition, 9780079039897…
Algebra
ISBN:
9780079039897
Author:
Carter
Publisher:
McGraw Hill
Linear Algebra: A Modern Introduction
Algebra
ISBN:
9781285463247
Author:
David Poole
Publisher:
Cengage Learning
Glencoe Algebra 1, Student Edition, 9780079039897…
Algebra
ISBN:
9780079039897
Author:
Carter
Publisher:
McGraw Hill


Holt Mcdougal Larson Pre-algebra: Student Edition…
Algebra
ISBN:
9780547587776
Author:
HOLT MCDOUGAL
Publisher:
HOLT MCDOUGAL

Big Ideas Math A Bridge To Success Algebra 1: Stu…
Algebra
ISBN:
9781680331141
Author:
HOUGHTON MIFFLIN HARCOURT
Publisher:
Houghton Mifflin Harcourt