Britney V You are the owner of Fast Break, a popular local place that sells drinks, snacks, and sandwiches. For inventory management purposes, you are examining how the weather affects the amount of hot chocolate sold in a day. You are going to gather a random sample of 9 days showing that day's high temperature (denoted by x, in °C) and the amount of hot chocolate sold that day (denoted by y, in liters). You will also note the product x y of the temperature and amount of hot chocolate sold for each day. (These products are written in the row labeled "xy"). Enpañol (a) Click on "Take Sample" to see the results for your random sample. High temperature, x (in °C) 22 15 6 33 28 3 15 6 11 Amount of hot Take Sample chocolate sold, y 6 12 3 2 17 10 14 15 (in liters) xy 132 105 72 99 56 51 150 84 165 Send data to calculator Based on the data from your sample, enter the indicated values in the column on the left below. Round decimal values to three decimal places. When you are done, select "Compute". (In the table below, n is the sample size and the symbol E xy means the sum of the values xy.) n: 5 ? Sample correlation coefficient (r): Slope (b): I xy: 0 y-intercept (bo): Compute (b) Write the equation of the least-squares regression line for your data. Then on the scatter plot for your data, graph this regression equation by plotting two points and then drawing the line through them. Round each coordinate to three decimal places. Regression equation: y = 0
Britney V You are the owner of Fast Break, a popular local place that sells drinks, snacks, and sandwiches. For inventory management purposes, you are examining how the weather affects the amount of hot chocolate sold in a day. You are going to gather a random sample of 9 days showing that day's high temperature (denoted by x, in °C) and the amount of hot chocolate sold that day (denoted by y, in liters). You will also note the product x y of the temperature and amount of hot chocolate sold for each day. (These products are written in the row labeled "xy"). Enpañol (a) Click on "Take Sample" to see the results for your random sample. High temperature, x (in °C) 22 15 6 33 28 3 15 6 11 Amount of hot Take Sample chocolate sold, y 6 12 3 2 17 10 14 15 (in liters) xy 132 105 72 99 56 51 150 84 165 Send data to calculator Based on the data from your sample, enter the indicated values in the column on the left below. Round decimal values to three decimal places. When you are done, select "Compute". (In the table below, n is the sample size and the symbol E xy means the sum of the values xy.) n: 5 ? Sample correlation coefficient (r): Slope (b): I xy: 0 y-intercept (bo): Compute (b) Write the equation of the least-squares regression line for your data. Then on the scatter plot for your data, graph this regression equation by plotting two points and then drawing the line through them. Round each coordinate to three decimal places. Regression equation: y = 0

Glencoe Algebra 1, Student Edition, 9780079039897, 0079039898, 2018
18th Edition
ISBN:9780079039897
Author:Carter
Publisher:Carter
Chapter10: Statistics
Section10.3: Measures Of Spread
Problem 1GP

Related questions
Question
Transcribed Image Text:Britney
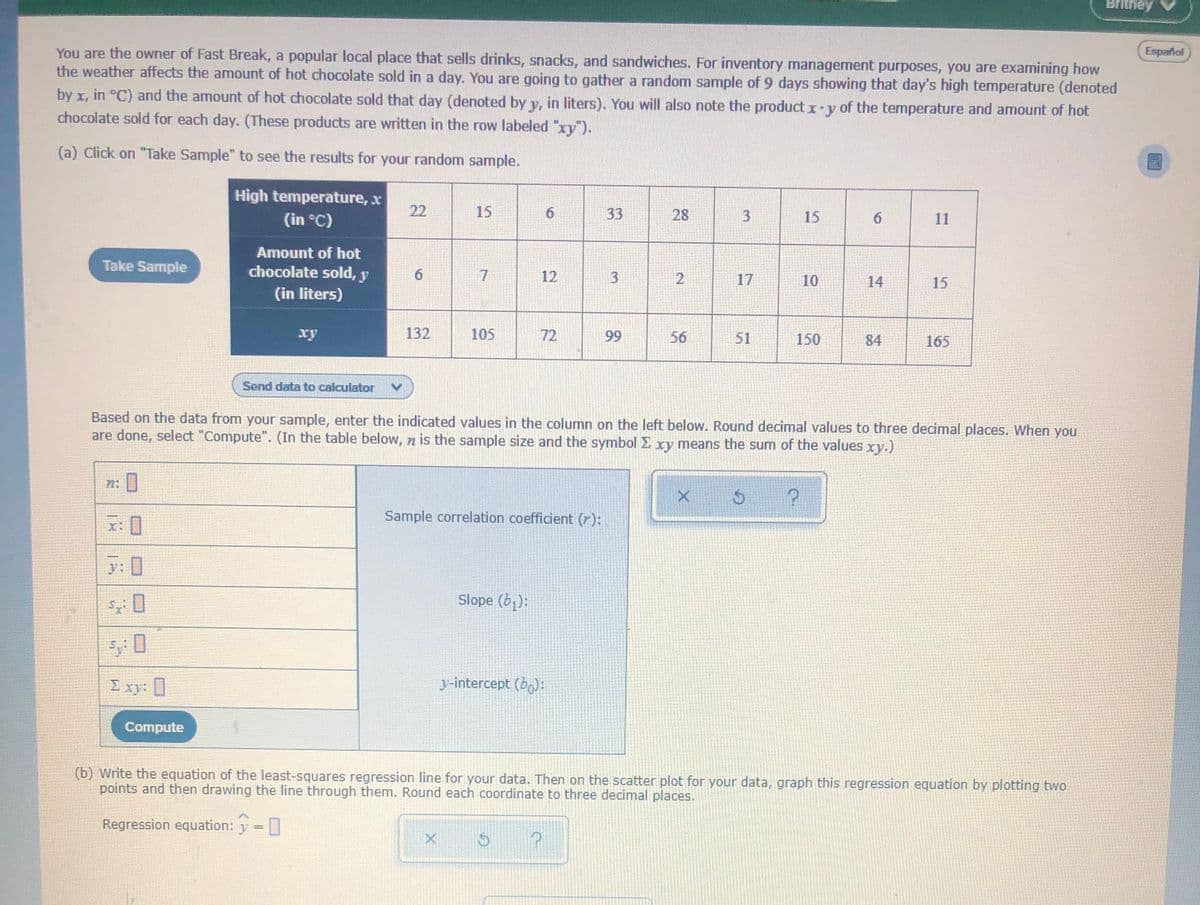
You are the owner of Fast Break, a popular local place that sells drinks, snacks, and sandwiches. For inventory management purposes, you are examining how
the weather affects the amount of hot chocolate sold in a day. You are going to gather a random sample of 9 days showing that day's high temperature (denoted
Español
by x, in °C) and the amount of hot chocolate sold that day (denoted by y, in liters). You will also note the product x-y of the temperature and amount of hot
chocolate sold for each day. (These products are written in the row labeled "xy").
(a) Click on "Take Sample" to see the results for your random sample.
High temperature, x
(in °C)
22
15
33
28
15
6.
11
Amount of hot
Take Sample
chocolate sold, y
6.
7.
12
2
17
10
14
15
(in liters)
ху
132
105
72
99
56
51
150
84
165
Send data to calculator
Based on the data from your sample, enter the indicated values in the column on the left below. Round decimal values to three decimal places. When you
are done, select "Compute". (In the table below, n is the sample size and the symbol E xy means the sum of the values xy.)
71:
Sample correlation coefficient (r):
X:
y: 0
Slope (b):
I xy:
y-intercept (b):
Compute
(b) Write the equation of the least-squares regression line for your data. Then on the scatter plot for your data, graph this regression equation by plotting two
points and then drawing the line through them. Round each coordinate to three decimal places.
Regression equation: y =
3,
31
Transcribed Image Text:Compute
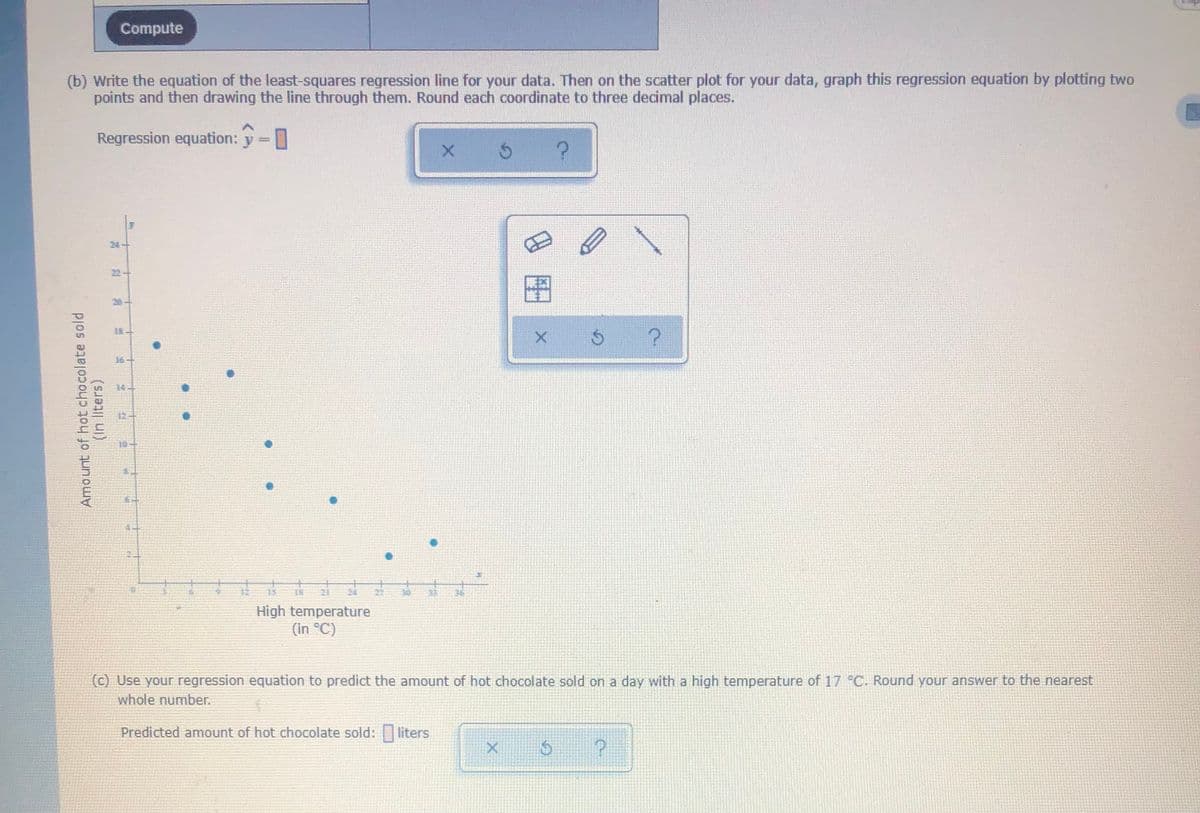
(b) Write the equation of the least-squares regression line for your data. Then on the scatter plot for your data, graph this regression equation by plotting two
points and then drawing the line through them. Round each coordinate to three decimal places.
Regression equation: y
24
22+
I8
16
144
10.
12
15
18
21
24
27
30
High temperature
(in °C)
(c) Use your regression equation to predict the amount of hot chocolate sold on a day with a high temperature of 17 °C. Round your answer to the nearest
whole number.
Predicted amount of hot chocolate sold:
liters
Amount of hot chocolate sold
(In liters)
Expert Solution
This question has been solved!
Explore an expertly crafted, step-by-step solution for a thorough understanding of key concepts.

This is a popular solution!

Trending now
This is a popular solution!

Step by step
Solved in 3 steps with 3 images

Recommended textbooks for you
Glencoe Algebra 1, Student Edition, 9780079039897…
Algebra
ISBN:
9780079039897
Author:
Carter
Publisher:
McGraw Hill

Holt Mcdougal Larson Pre-algebra: Student Edition…
Algebra
ISBN:
9780547587776
Author:
HOLT MCDOUGAL
Publisher:
HOLT MCDOUGAL

College Algebra (MindTap Course List)
Algebra
ISBN:
9781305652231
Author:
R. David Gustafson, Jeff Hughes
Publisher:
Cengage Learning
Glencoe Algebra 1, Student Edition, 9780079039897…
Algebra
ISBN:
9780079039897
Author:
Carter
Publisher:
McGraw Hill
Holt Mcdougal Larson Pre-algebra: Student Edition…
Algebra
ISBN:
9780547587776
Author:
HOLT MCDOUGAL
Publisher:
HOLT MCDOUGAL
College Algebra (MindTap Course List)
Algebra
ISBN:
9781305652231
Author:
R. David Gustafson, Jeff Hughes
Publisher:
Cengage Learning