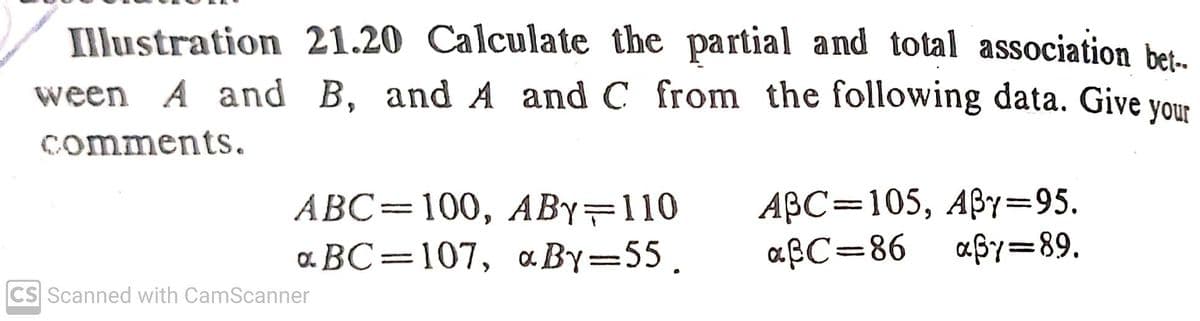
Illustration 21.20 Calculate the partial and total association bet. ween A and B, and A and C from the following data. Give your comments. ABC=105, ABY=95. aßC=86 a$y=89. ABC=100, ABY=110 a. BC=107, a.By=55.


Q: please interpret the models
A: Residual plots and normal probability plots are diagnostic tools for checking the simple linear…
Q: A coefficient of correlation of -1 means that there is no linear correlation between two variables.…
A: According to the given information, we have Correlation coefficient, r = -1
Q: Assume that we want to construct a confidence interval. Do one of the following, as appropriate: (a)…
A: We have given that Confidence level (c) = 99% = 0.99 σ is not known Sample size (n) = 55
Q: Fit a parabolic equation of second degree to the following data and obtain the trend values…
A:
Q: A grade 7 class adviser wants to find the age of his/her advisory. It happens that it is during the…
A:
Q: question 1 a)List the basic requirement for the t-test b) Explain the relationship between two…
A:
Q: 3. There are 8 students running for 5 different leadership positions (ie President, VP,). How many…
A:
Q: A store only sells two types of products: type A and type B. If a customer only buys product A, the…
A: Given that, A store only sells two types of products: type A and type B. If a customer only buys…
Q: You must show ALL the detail of your work, only presenting the final results Provide answer with 3…
A:
Q: Find the median for the data items in the given frequency distribution. Score, x Frequency, f 1 3 4…
A:
Q: t of 11 data pairs (x,y) were collected and were found to have a linear relationship given by: B.04…
A: Given A set of 11 data pairs (x,y) a linear relationship given by: y = 3.04 x + 0.99
Q: You may need to use the appropriate appendix table or technology to answer this question. If you…
A: Rolling a die 100 times n=100
Q: 15. 1 P(x) .30 .70 2.
A: Let X be the random variable having probability mass function is, X 1 3 P(x) 0.30 0.79…
Q: domly summary statistics for nfidence level. Are these results very different from the confidence…
A: The sample size is 246; n=246 x=32.9s=6.3 α=0.01
Q: PROBLEM 2: The researcher conducted an experiment to determine whether chocolate cake has an effect…
A:
Q: A product engineer wants to optimize the cutting of strips of wood, which are used to make plywood.…
A: 1) The objective is to test whether there is a significant difference in mean of torque force for…
Q: What is the area to the right of the z-score -2.26? 0.0119 0.5119 0.9881 0.4881
A: The area to the right of the z-score is -2.26
Q: Are the mean weights of young adult men and women significantly different from each other? Assume…
A: 1. Null Hypothesis: H0: There is no difference in the mean weights of men and women. Alternative…
Q: The restaurant manager listed down the amount of meal ordered (x) and the tip (y) left by five…
A: Given Information: The independent variable (x) is amount of meal ordered. The dependent variable…
Q: A set of 11 data pairs (x,y) were collected and were found to have a linear relationship given by: y…
A:
Q: Q4. Draw the sample space of: 1. Throwing two dice 2. When Four coins are tossed together 3. A…
A: As per company guidelines I solved exactly three subparts of the question ..thank you
Q: Which one of the following sequences satisfies the recursive relation an+1=2xan, assuming we call it…
A: Recurrence relation is broadly classified into two parts, they are initial value and the recurrence…
Q: Labor Cost ($) Procurement Probability Probability Transportation Cost ($) Probability Cost ($) 10…
A: *Answer: Given data: Procurement Cost ($) Probability Labor cost Probability Transportation…
Q: 3. (Example 3) Suppose a random sample of 45 male firefighters are tested for plasma volume. The…
A:
Q: medical researchers knew from previous studies that in the past, about 39% of all men between the…
A: Hello! As you have posted more than 3 sub parts, we are answering the first 3 sub-parts. In case…
Q: Is the graph shown a probability distributión (prob density function) of a continuous random…
A: Subject to validation of certain assumptions, a graph can be termed a probability mass function or…
Q: The taxi and takeoff time for commercial jets is a random variable x with a mean of 8.8 minutes and…
A: Given mean of 8.8 minutes standard deviation of 2.9 minutes
Q: the purchase cost, the labor cost, and the transportation cost are estimated as follows. Focurement…
A: *Answer:
Q: The Land Transportation Office (LTO) is an agency of the Philippine government under the Department…
A: Given Information: Let A denote that the new driver has had diver education. Then, PA=40%=0.4 Let B…
Q: i. Find the following probablities. Points per game frequency 10 15 12 TOTAL:47 11. P(x>1) = 12.…
A:
Q: Find the missing values in the following ANOVA TABLE for a study that consist of 5 treatments with…
A: For the given data Find dfbetween=? MSbetween? SSWithin=? dfwithin=? MSwithin=? SStotal =? dftotal…
Q: The National Assessment for Educational Progress (NAEP) is a U.S. government organization that…
A: Scatter plot is the graphical representation of the relationship between two variables of a…
Q: 1. A biologist knows that the average length of a leaf of a certain plant is 4 inches. The standard…
A: Given Population mean μ=4, standard deviations σ=0.6, n=20, sample mean x̄=4.2, level of…
Q: Porphyrin is a pigment in blood protoplasm and other body fluids that is significant in body energy…
A: Mean(µ) = 38Standard deviations (σ) = 12X ~ N (µ, σ )= N(38, 12)
Q: Group1: 12, 10, 3 , 6, 12 Group 2: 13, 9, 5, 8 Group 3: 22, 20 15, 10, 18, 14 Conduct Scheffe tests…
A: Data for 3 groups given Used terms - SS - sum of squares Df- degree of freedom MS - mean squares…
Q: please interpret the model
A: The objective is to interpret the given model between tfr against contraceptors.
Q: E (a) Show that the joint pdf for U, V is of the form f(r, y) = { exp(-u- v), if (u, v) E A…
A: We will use Jacobian method of transformation to transform the X and Y to U and V.
Q: 3. (Example 3) Suppose a random sample of 45 male firefighters are tested for plasma volume. The…
A:
Q: 6.38 Parasitic worm. Lymphatic filariasis is a disease caused by a parasitic worm. Complications of…
A: Chi square test is a nonparametric test.
Q: Here is a set of sample data 11 12 22 28 29 40 50 32 59 62 67 75 93 95 98 Identify the 5 number…
A: The minimum value is, 11 The maximum value is, 98 The first quartile is, Therefore, the first…
Q: 1. Is the graph shown a probability distribution of a discrete random variable? Why or why not?
A:
Q: 18 26 33 40 44 45 49 75 80 125
A: “Since you have posted a question with multiple sub-parts, we will solve first three subparts for…
Q: eam Name Division W L PCT Attendance Buffalo Bisons North 66 77 0.462 8818 Lehigh Valley IronPigs…
A: Note: AS per the guidelines, we are allowed to answer single question at a time. Kindly repost the…
Q: Suppose X has a Poisson distribution with parameter A and suppose the conditional distribution of Y…
A: It is given that X follows Poisson(λ) Y | X = x follows Exponential(θ = x+1)
Q: Write the description of the data. Write the analysis. Write some related readings of the shown…
A: Analysis of the data is the process of analyzing each observation in order to find out the…
Q: 11. it X-N(A - 200. e - 100), which af the fallowing is FALSE 100), which of the following is A…
A:
Q: ) Find P(x < 61). We need to first convert the probability P(x < 61) to a corresponding…
A: Let X be the random variable from normal distribution then we will find the probability, P(X<61)…
Q: What are you drinking? Environmental Protection Agency standards require that the amount of lead in…
A: For the given data fill the required blank
Q: Ages Number of students 15-18 2 19-22 4 23-26 7 27-30 8 31-34 8 35-38 8 Based on the freq
A: We are given the frequency distribution. Total number of students = 2+4+7+8+8+8 = 37 We need to…
Q: n= 658 i Determine the expected count for each outcome. 1 2 3 4 Pi 0.11 0.33 0.24 0.32 ... The…
A: Solution-; Given: n=658 We have following table: i 1 2 3 4 pi 0.11 0.33 0.24 0.32 We find…


Trending now
This is a popular solution!

Step by step
Solved in 3 steps with 3 images

- If a child psychologist wanted to determine if there is a relationship between gender of a child and favorite color from the choices of Blue, Green, Yellow, and Red what type of test would she want to run? ExplainMary ann,hazel,and analyn want to know what numbers can be assigned for the frequency of heads that will occur on tossing three coinsInterpret the table following the suggested guidlines.
- The data collected from the 12 female & the calculations asking in the project are shown in the table belowAt State College last term, 68 of the students in a Physics course earned As, 81 earned Bs, 114 got Cs, 92 were issued Ds, and 59 failed the course. If this grade distribution was graphed on a pie chart, how many degrees would be used to indicate the C region?Show me the steps of determine yellow And use the two eqautions
- A mining company finds that daily lost-work injuries average 1.2. If the local union contract has a clause requiring that the mine be shut down as soon as three workers incur lost-work injuries, on what percentage of the days will the mine be operational throughout the day?If 200 subjects were studied and 120 of them expressed a preference for brand x, what percentage expressed a preference for brand x? Round to the nearest tenth percentageThe following table shows the number of siblings and daily allowance of 12 students from a Grade 11 class:
- Based on the results of the poll,how many of the school's students should be expected to travel by plane over spring break?The amount of money earned in a day by Ms. Anne’s craft shop was recorded and displayed in the stem-and-leaf diagram shown below in Exhibit 1.If the Syracuse men's basketball team won 18 games and lost 10, and the Syracuse women's basketball team won 15 and lost 9, what is the overall frequency of losses for the two teams?"