(c) By hand, make a histogram and using this histogram select the correct description of the age at which women have their first child. The distribution is: (d) In which age classes do the median and quartiles fall in the ordered list of all maternal ages? Median falls within: Q1 falls within: Q3 falls within:
(c) By hand, make a histogram and using this histogram select the correct description of the age at which women have their first child. The distribution is: (d) In which age classes do the median and quartiles fall in the ordered list of all maternal ages? Median falls within: Q1 falls within: Q3 falls within:

MATLAB: An Introduction with Applications
6th Edition
ISBN:9781119256830
Author:Amos Gilat
Publisher:Amos Gilat
Chapter1: Starting With Matlab
Section: Chapter Questions
Problem 1P

Related questions
Topic Video
Question
Also this after the 2nd picture.
(c) By hand, make a histogram and using this histogram select the correct description of the age at which women have their first child.
The distribution is:
(d) In which age classes do the median and quartiles fall in the ordered list of all maternal ages?
Median falls within:
Q1 falls within:
Q3 falls within:
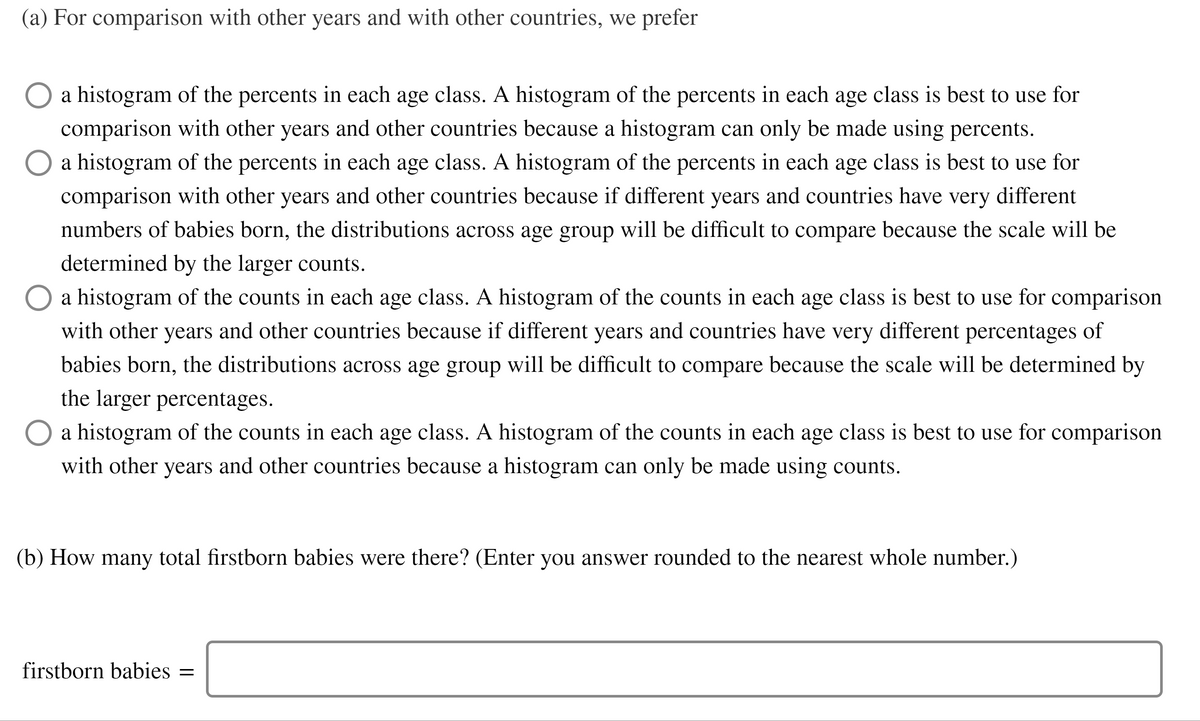
Transcribed Image Text:(a) For comparison with other years and with other countries, we prefer
a histogram of the percents in each age class. A histogram of the percents in each age class is best to use for
comparison with other years and other countries because a histogram can only be made using percents.
O a histogram of the percents in each age class. A histogram of the percents in each age class is best to use for
comparison with other years and other countries because if different years and countries have very different
numbers of babies born, the distributions across age group will be difficult to compare because the scale will be
determined by the larger counts.
O a histogram of the counts in each age class. A histogram of the counts in each age class is best to use for comparison
with other years and other countries because if different years and countries have very different percentages of
babies born, the distributions across age group will be difficult to compare because the scale will be determined by
the larger percentages.
O a histogram of the counts in each age class. A histogram of the counts in each age class is best to use for comparison
with other years and other countries because a histogram can only be made using counts.
(b) How many total firstborn babies were there? (Enter you answer rounded to the nearest whole number.)
firstborn babies =
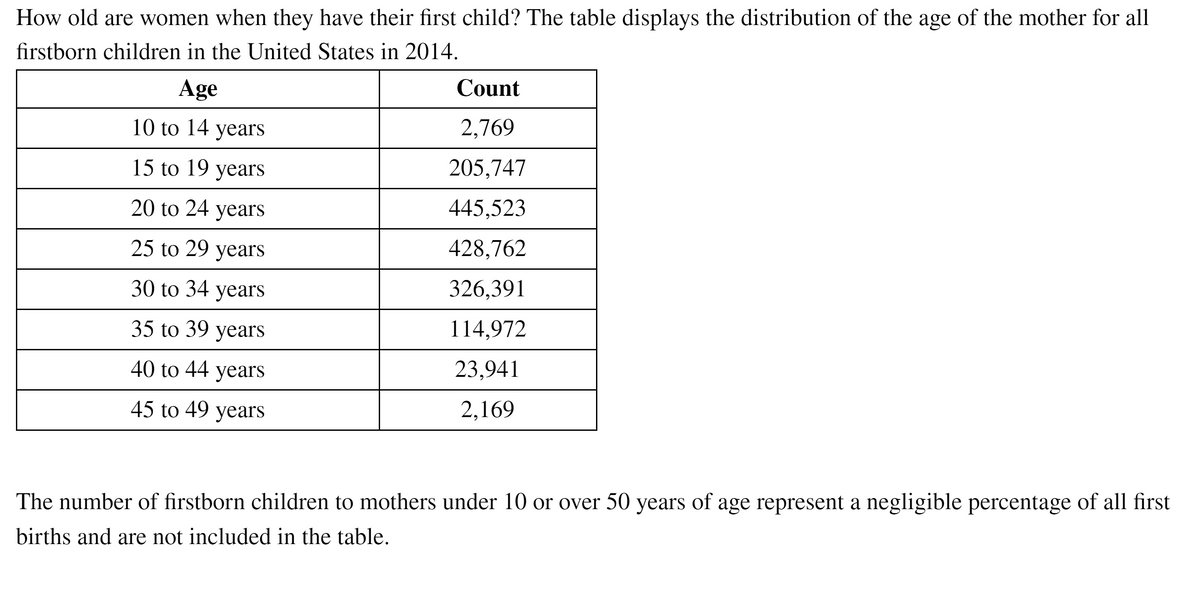
Transcribed Image Text:How old are women when they have their first child? The table displays the distribution of the age of the mother for all
firstborn children in the United States in 2014.
Age
Count
10 to 14 yearS
2,769
15 to 19 years
205,747
20 to 24
years
445,523
25 to 29 years
428,762
30 to 34 years
326,391
35 to 39 years
114,972
40 to 44 years
23,941
45 to 49 years
2,169
The number of firstborn children to mothers under 10 or over 50 years of age represent a negligible percentage of all first
births and are not included in the table.
Expert Solution
This question has been solved!
Explore an expertly crafted, step-by-step solution for a thorough understanding of key concepts.

This is a popular solution!

Trending now
This is a popular solution!

Step by step
Solved in 3 steps with 1 images

Knowledge Booster


Learn more about
Need a deep-dive on the concept behind this application? Look no further. Learn more about this topic, statistics and related others by exploring similar questions and additional content below.Recommended textbooks for you
MATLAB: An Introduction with Applications
Statistics
ISBN:
9781119256830
Author:
Amos Gilat
Publisher:
John Wiley & Sons Inc

Probability and Statistics for Engineering and th…
Statistics
ISBN:
9781305251809
Author:
Jay L. Devore
Publisher:
Cengage Learning

Statistics for The Behavioral Sciences (MindTap C…
Statistics
ISBN:
9781305504912
Author:
Frederick J Gravetter, Larry B. Wallnau
Publisher:
Cengage Learning
MATLAB: An Introduction with Applications
Statistics
ISBN:
9781119256830
Author:
Amos Gilat
Publisher:
John Wiley & Sons Inc
Probability and Statistics for Engineering and th…
Statistics
ISBN:
9781305251809
Author:
Jay L. Devore
Publisher:
Cengage Learning
Statistics for The Behavioral Sciences (MindTap C…
Statistics
ISBN:
9781305504912
Author:
Frederick J Gravetter, Larry B. Wallnau
Publisher:
Cengage Learning

Elementary Statistics: Picturing the World (7th E…
Statistics
ISBN:
9780134683416
Author:
Ron Larson, Betsy Farber
Publisher:
PEARSON

The Basic Practice of Statistics
Statistics
ISBN:
9781319042578
Author:
David S. Moore, William I. Notz, Michael A. Fligner
Publisher:
W. H. Freeman

Introduction to the Practice of Statistics
Statistics
ISBN:
9781319013387
Author:
David S. Moore, George P. McCabe, Bruce A. Craig
Publisher:
W. H. Freeman