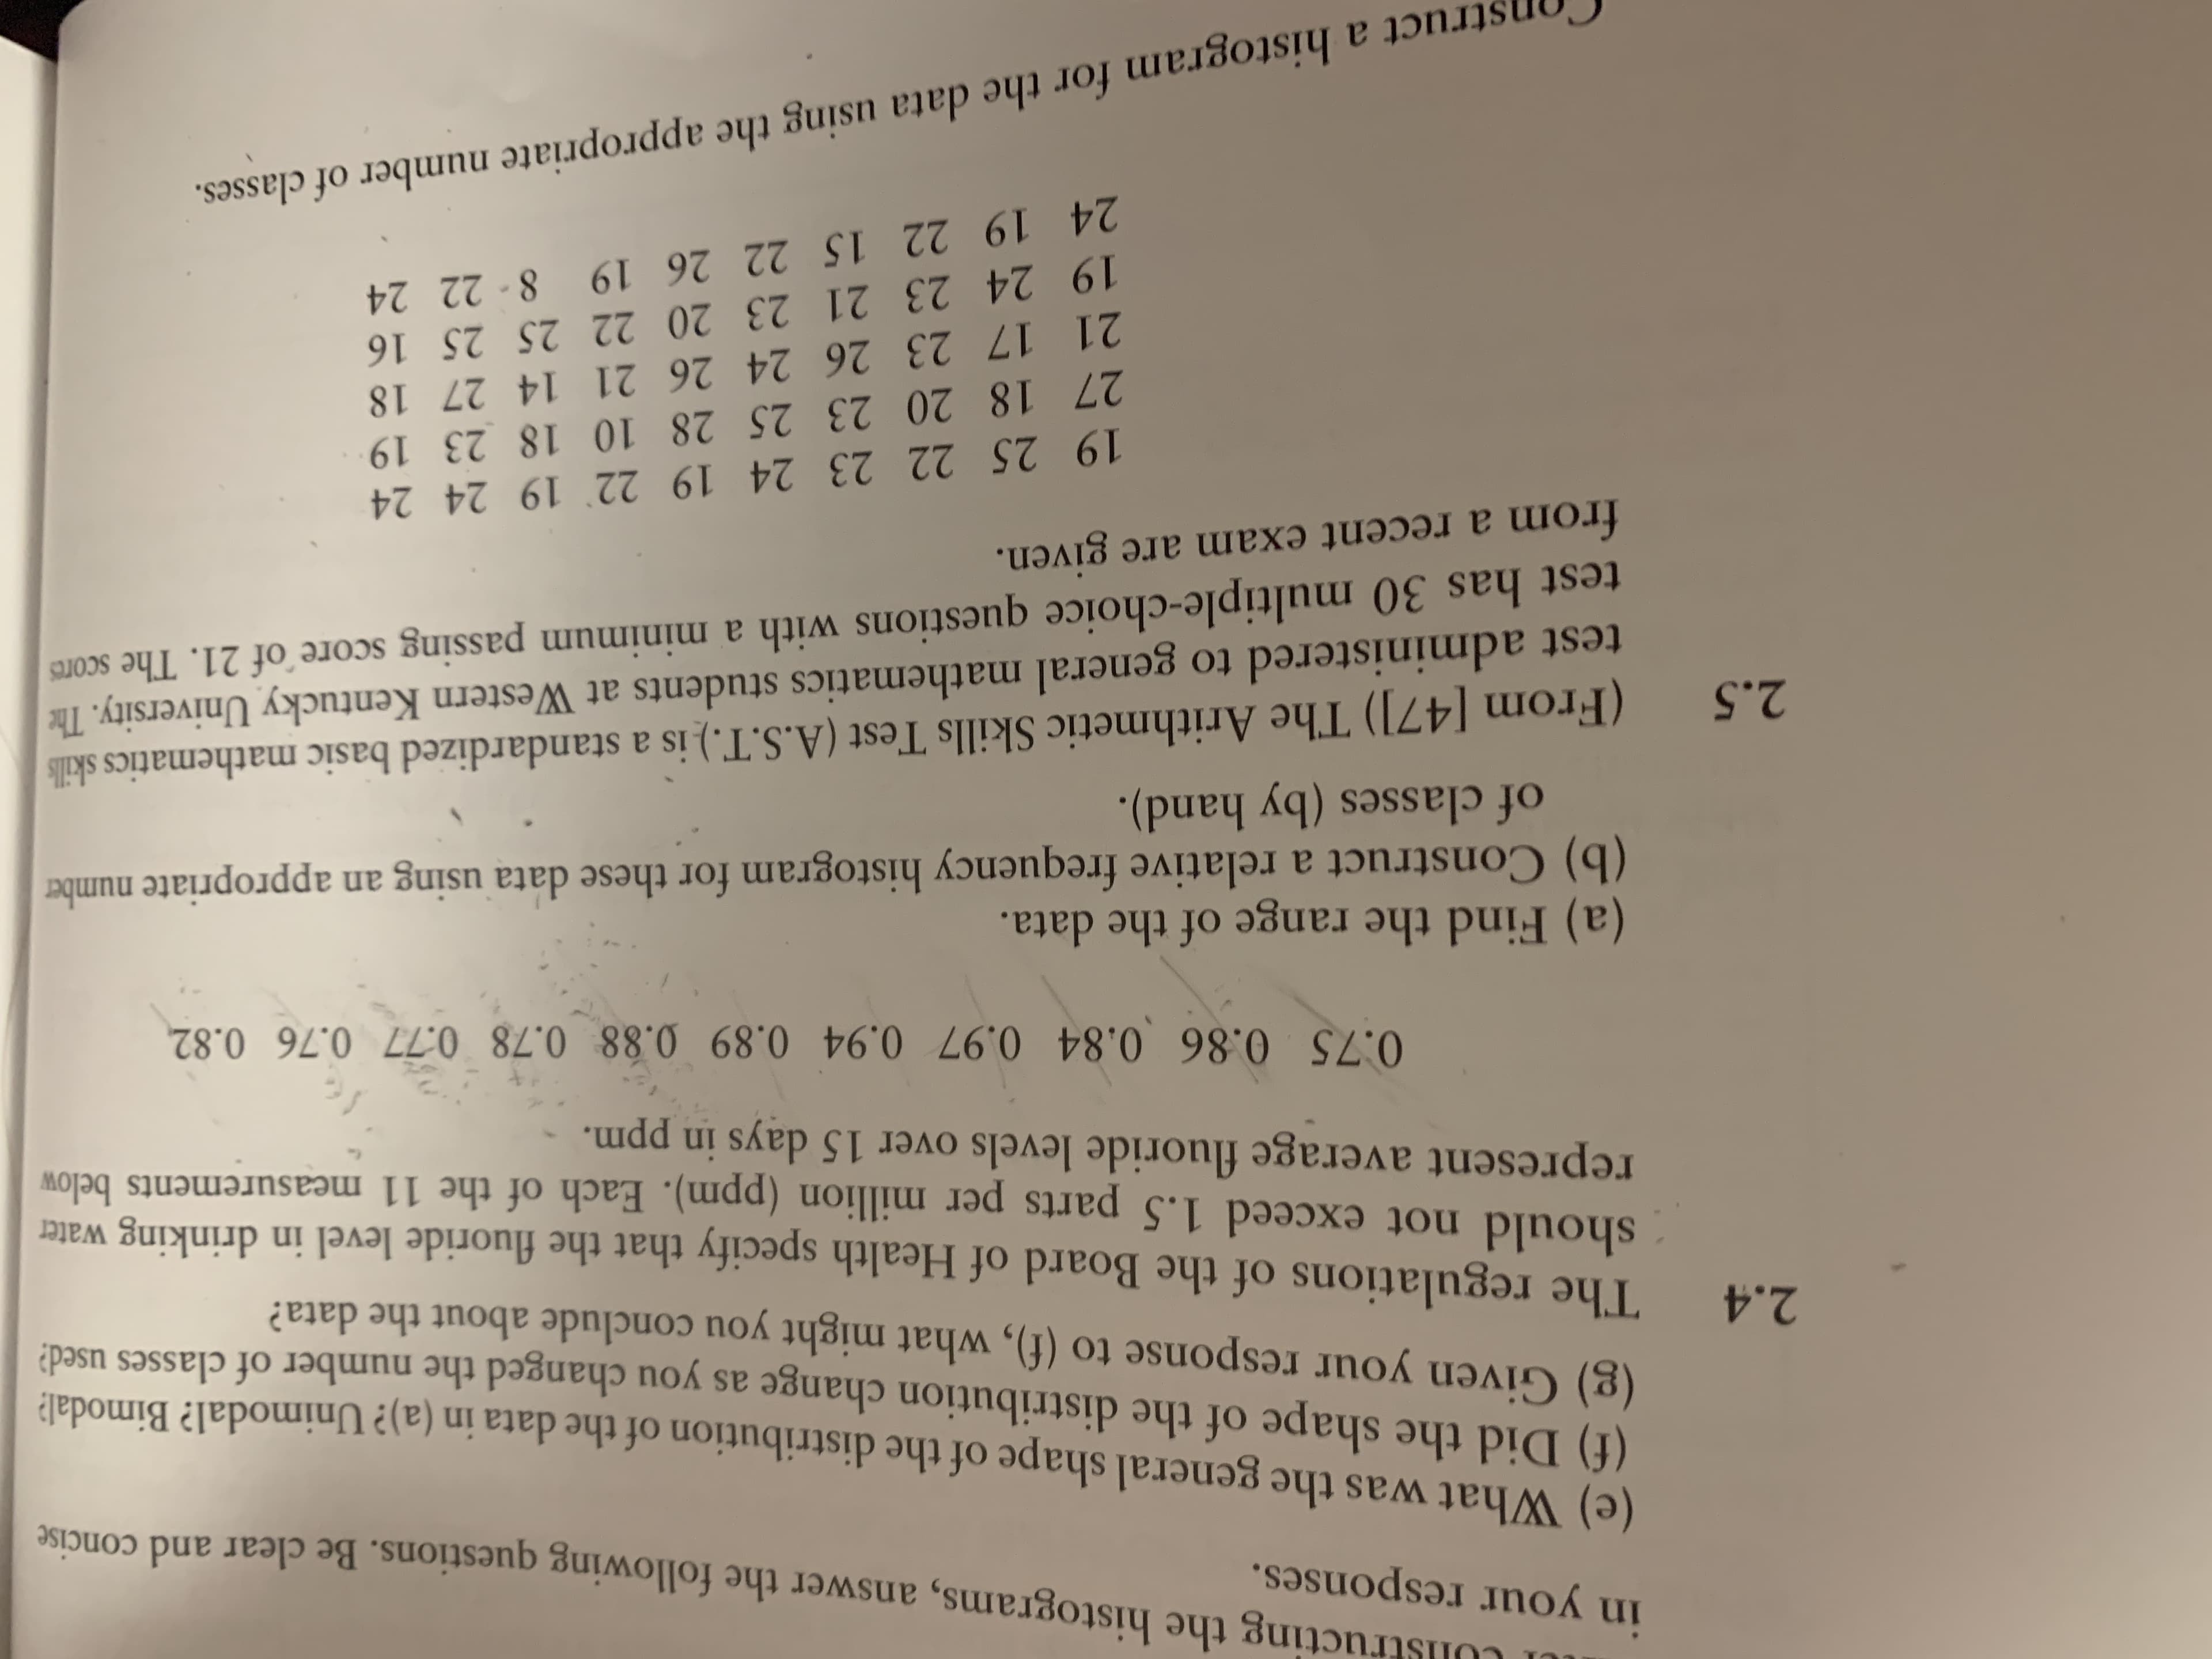
Culnstructing the histograms, answer the following questions. Be clear and concise in your responses. (e) What was the general shape of the distribution of the data in (a)? Unimodal? Bimodal? (f) Did the shape of the distribution change as you changed the number of classes used? (g) Given your response to (f), what might you conclude about the data? 2.4 The regulations of the Board of Health specify that the fluoride level in drinking water should not exceed 1.5 parts per million (ppm). Each of the 11 measurements below represent average fluoride levels over 15 days in ppm. 0.75 0.86 0.84 0.97 0.94 0.89 0.88 0.78 0.77 0.76 0.82 (a) Find the range of the data. (b) Construct a relative frequency histogram for these data using an appropriate number of classes (by hand). (From [47|) The Arithmetic Skills Test (A.S.T.) is a standardized basic mathematics skills test administered to general mathematics students at Western Kentucky University. The test has 30 multiple-choice questions with a minimum passing score 'of 21. The scores from a recent exam are given. 19 25 22 23 24 19 22 19 24 24 27 18 20 23 25 28 10 18 23 19 21 17 23 26 24 26 21 14 27 18 19 24 23 21 23 20 22 25 25 16 8 22 24 24 19 22 1S 22 26 19 ruct a histogram for the data using the appropriate number of classes.


Family of Curves
A family of curves is a group of curves that are each described by a parametrization in which one or more variables are parameters. In general, the parameters have more complexity on the assembly of the curve than an ordinary linear transformation. These families appear commonly in the solution of differential equations. When a constant of integration is added, it is normally modified algebraically until it no longer replicates a plain linear transformation. The order of a differential equation depends on how many uncertain variables appear in the corresponding curve. The order of the differential equation acquired is two if two unknown variables exist in an equation belonging to this family.
XZ Plane
In order to understand XZ plane, it's helpful to understand two-dimensional and three-dimensional spaces. To plot a point on a plane, two numbers are needed, and these two numbers in the plane can be represented as an ordered pair (a,b) where a and b are real numbers and a is the horizontal coordinate and b is the vertical coordinate. This type of plane is called two-dimensional and it contains two perpendicular axes, the horizontal axis, and the vertical axis.
Euclidean Geometry
Geometry is the branch of mathematics that deals with flat surfaces like lines, angles, points, two-dimensional figures, etc. In Euclidean geometry, one studies the geometrical shapes that rely on different theorems and axioms. This (pure mathematics) geometry was introduced by the Greek mathematician Euclid, and that is why it is called Euclidean geometry. Euclid explained this in his book named 'elements'. Euclid's method in Euclidean geometry involves handling a small group of innately captivate axioms and incorporating many of these other propositions. The elements written by Euclid are the fundamentals for the study of geometry from a modern mathematical perspective. Elements comprise Euclidean theories, postulates, axioms, construction, and mathematical proofs of propositions.
Lines and Angles
In a two-dimensional plane, a line is simply a figure that joins two points. Usually, lines are used for presenting objects that are straight in shape and have minimal depth or width.
2.4


Trending now
This is a popular solution!

Step by step
Solved in 4 steps with 3 images


