C) Calculate d and sg. d = (Type an integer or a decimal. Round to three decimal places as needed.) Calculate %3D (Type an integer or a decimal. Round to three decimal places as needed.) E) Use the t-test to find the standardized test statistic t. t = (Tune an integer or a decimal Round to three decimal nlaces as neededY
C) Calculate d and sg. d = (Type an integer or a decimal. Round to three decimal places as needed.) Calculate %3D (Type an integer or a decimal. Round to three decimal places as needed.) E) Use the t-test to find the standardized test statistic t. t = (Tune an integer or a decimal Round to three decimal nlaces as neededY

Algebra & Trigonometry with Analytic Geometry
13th Edition
ISBN:9781133382119
Author:Swokowski
Publisher:Swokowski
Chapter10: Sequences, Series, And Probability
Section10.8: Probability
Problem 31E

Related questions
Topic Video
Question
Transcribed Image Text:(1).
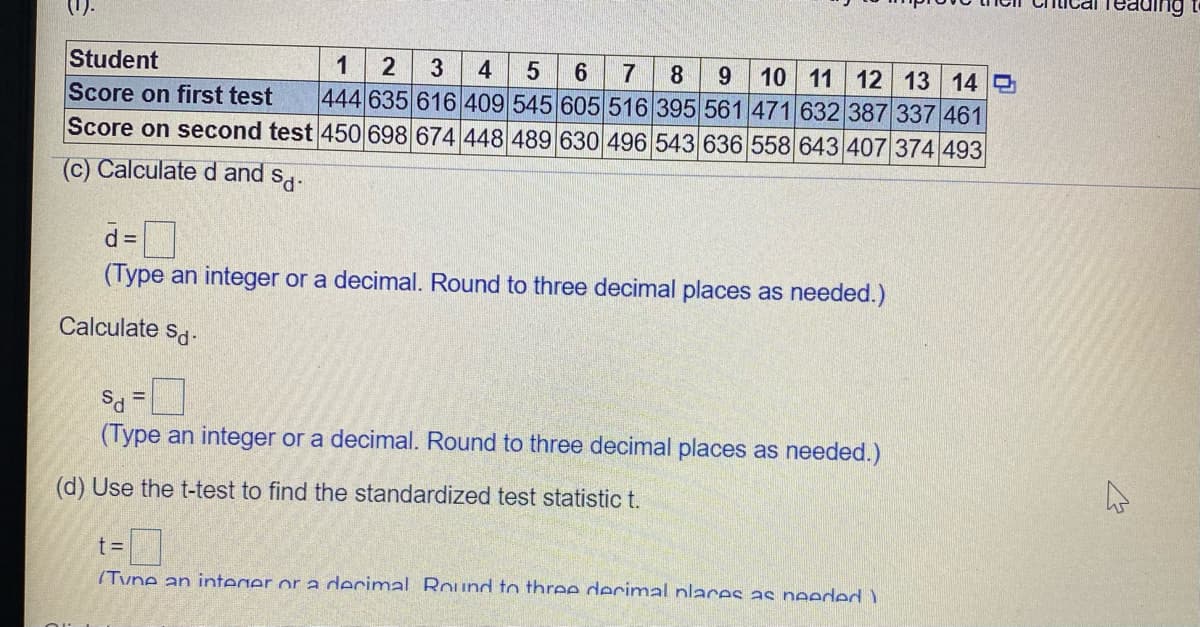
Student
Score on first test
3
10 11 12 13 14
444 635 616 409 545 605 516 395 561 471 632 387 337 461
Score on second test 450 698 674 448 489 630 496 543 636 558 643 407 374 493
4
8.
(c) Calculate d and
d =
(Type an integer or a decimal. Round to three decimal places as needed.)
Calculate sd.
(Type an integer or a decimal. Round to three decimal places as needed.)
(d) Use the t-test to find the standardized test statistic t.
t%3D
(Tune an integer or a decimal Round to three decimnal places as neededY
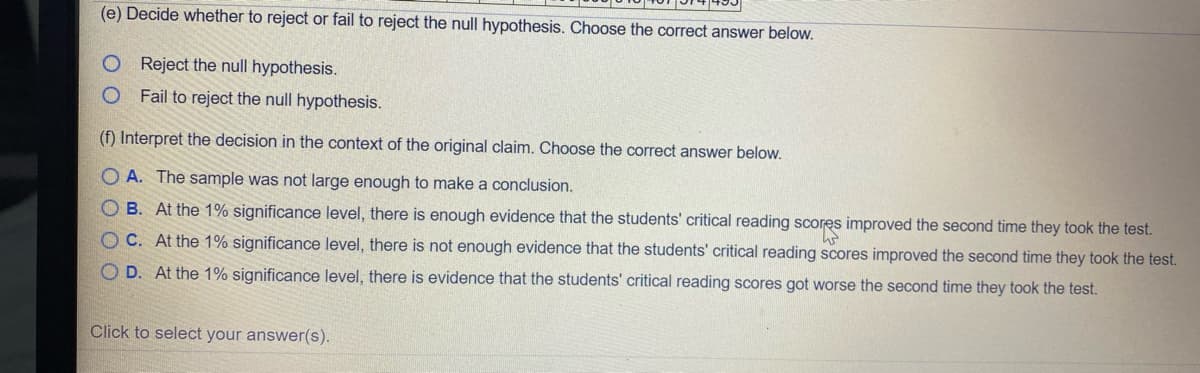
Transcribed Image Text:(e) Decide whether to reject or fail to reject the null hypothesis. Choose the correct answer below.
Reject the null hypothesis.
Fail to reject the null hypothesis.
(f) Interpret the decision in the context of the original claim. Choose the correct answer below.
O A. The sample was not large enough to make a conclusion.
O B. At the 1% significance level, there is enough evidence that the students' critical reading scores improved the second time they took the test.
O C. At the 1% significance level, there is not enough evidence that the students' critical reading scores improved the second time they took the test.
O D. At the 1% significance level, there is evidence that the students' critical reading scores got worse the second time they took the test.
Click to select your answer(s).
Expert Solution
This question has been solved!
Explore an expertly crafted, step-by-step solution for a thorough understanding of key concepts.

This is a popular solution!

Trending now
This is a popular solution!

Step by step
Solved in 2 steps with 7 images

Knowledge Booster


Learn more about
Need a deep-dive on the concept behind this application? Look no further. Learn more about this topic, statistics and related others by exploring similar questions and additional content below.Recommended textbooks for you
Algebra & Trigonometry with Analytic Geometry
Algebra
ISBN:
9781133382119
Author:
Swokowski
Publisher:
Cengage
Algebra & Trigonometry with Analytic Geometry
Algebra
ISBN:
9781133382119
Author:
Swokowski
Publisher:
Cengage