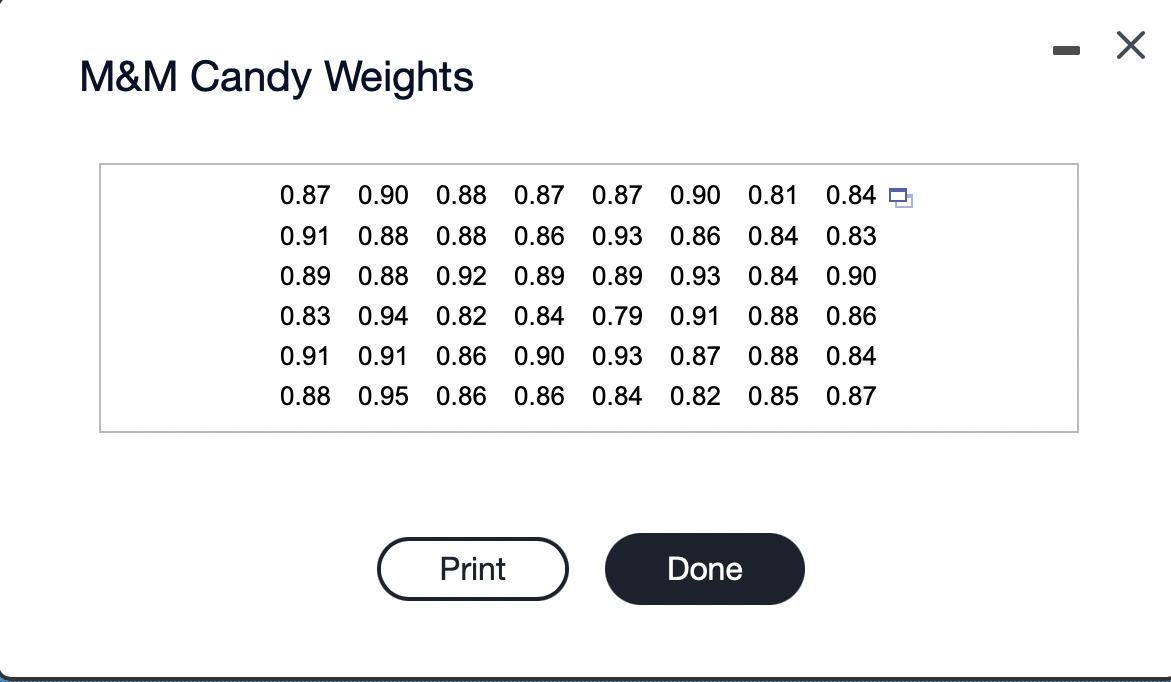
(c) Use the Empirical Rule to determine the percentage of M&Ms with weights between 0.802 and 0.946 gram. Hint: x = 0.874. |% (Type an integer or decimal. Do not round.)


Q: 4. 66% of Americans support death penalty (Gallup, 2004). Seven people are randomly selected. Let…
A: Given that n=7 , p=66%=0.66 X~Binomial(n=7,p=0.66)
Q: is to be chosen at random to recommend a new company president. What is the probability 7. A board…
A: Hello! As you have posted 2 different questions, we are answering the first question. In case you…
Q: 15. A football team scores on average 2.25 goals per game, what is the probability that the team…
A: Let us denote X be the football team scores per game follows Poisson distribution with average of…
Q: a. Adding sensitizing rules to a Shewhart control charts is encouraged because they do not change…
A: Note: Hi there! Thank you for posting the question. As you have posted multiple questions, as per…
Q: Suppose the manager agrees to pay each employee a $50 bonus if they meet a certain goal. On a…
A: Given that
Q: 9. Bank A and Bank B have each developed an improved process for serving customers. The waiting…
A: Since you have posted a question with multiple sub-parts, we will solve first three subparts for…
Q: The number and frequency of a certain ocean's hurricanes annually from 1935 through 2010 is shown…
A: Given that
Q: 4. Entry to a certain University is determined by a national test. The scores on this test are…
A:
Q: The following ACF plot indicates that the series is stationary. Is True or False?
A: A time series is said to be stationary if it has constant mean, variance and the covariance is…
Q: A set of n = 15 pairs of X and Y scores has SSy = 10, SSy = 40, and SP = 30. What is the slope for…
A: Given that n=15 , SSX=10 , SSY=40 , SSP=30 Find the slope
Q: Fireworks and Injuries These data were obtained for the years 1993 through 1998 and indicate the…
A:
Q: The graph below shows the relationship between customer satisfaction and service staff cheerfulness.…
A:
Q: Given the following scatterplot, if the point in the upper right corner were removed, what will…
A: Given a scatter plot and we have to choose the correct option related to correlation coefficient.
Q: 2. Determine if there is relationship between the age of person in years and their weight in kg…
A:
Q: 14. The following shows the probability distribution for the number of daily red-light traffic…
A: Let X be the random variable having probability mass function is, X P(x) 6 0.15 7 0.25 8…
Q: According to Runzheimer International, a typical business traveler spends an average of $281 per day…
A: We have given that Mean(µ) = 281 Population Standard deviations (σ) = 47 Sample size (n) = 50
Q: he claim is that smokers have a mean cotinine level greater than the level of 2.84 ng / mL found for…
A: Given that Sample size n =918 Population mean =2.84 Test statistic t =56.582
Q: 2. An achievement test in Statistics was administered to BS Math sophomore in 3 colleges. Determine…
A:
Q: A medical statistician wants to estimate the average weight loss of people who are on a new diet…
A: Solution: Given information: σ= 10 Population standard deviation E= 2 Margin of error C= 0.9=90%…
Q: A study was done to look at the relationship between number of vacation days employees take each…
A: The independent variable is Vacation Days. The dependent variable is Sick Days. This is simple…
Q: PART II: MEASURES OF CENTRAL TENDENCY AND VARIABILITY (GROUPED DATA) Direction: Complete the…
A: Find mean, median mode and variance and standard deviations.
Q: The failure time of a certain component has a Weibull distribution with B = 4, 0 = 2000, and y =…
A:
Q: Calculate SSx, SSy, and r for the following set of data: Y 1 4 SSx = SSy = %3D r = 7. 6 2.
A: List of formulae : SSx = ∑x2 - ∑x2n SSy = ∑y2 - ∑y2n SSxy = ∑xy - ∑x∑yn r = SSxySSx×SSy
Q: The ages of all the patients in the isolation ward of the hospital are 38, 26, 13, 41, and 22. What…
A:
Q: A random sample of 40 companies with assets over $10 million was surveyed and asked to indicate…
A:
Q: Task 3 In an electronic load-measuring system, under certain adve of an error on each sampling cycle…
A: States Type 1 Error State 2 Non-error State Type Probabilities Error preceded by error…
Q: 10% of your emails are spam emails. Your spam filter catches spam 90% of the time. Your spam filter…
A: Please see attached file below
Q: Practice with the t distribution. An independent random sample is selected from an ap- proximately…
A: Given the formula for confidence interval of t distribution. We have to find the critical value C…
Q: Refer back to the data in Exercise 4, in which y = ammo- nium concentration (mg/L) and x…
A: Given that, y = ammonium concentration (mg/L) and x transpiration (ml/h). Summary quantities include…
Q: Sampling 4 pieces of precision-cut wire (to be used in computer assembly) every hour for the past 24…
A: Control limits for x-bar chart: Consider,
Q: You're a sociologist studying whether grocery prices are different in the inner cities than they are…
A: Null hypothesis: H0:The average inner city prices are equal to suburban average prices. Alternative…
Q: Use the t-distribution to find a confidence interval for a difference in means estimate for a…
A:
Q: The heart rate of 20 patients in the ICU have a mean of 95.3 beats per minute and a standard…
A: Given that n = 20 , μ = 95.3 , σ = 19.6
Q: Use the t-distribution to find a confidence interval for a difference in means - given the relevant…
A:
Q: A grandmother leaves all of her assets to a charity except three items. She leaves her house, a car,…
A: Grandchild 1's total value is 150+6+3= 159 Share is 159/3= 53 Grandchild 2's total value is 170+8+5=…
Q: Two random samples of 15 customers in diferent banks were selected and their wait times (in minutes)…
A: Given that The data of two random variable is given We have to apply the F test for the claim that…
Q: State Farm Insurance studies show that in Colorado, 65% of the auto insurance claims submitted for…
A: Given that n=8 , p=65%=0.65 , q=1-p=1-0.65=0.35 R~Binomial(n=8,p=0.65) r be the number of claims…
Q: The least squares method is the criterion of best fit most commonly used in linear regression. This…
A: The least-square method is a procedure is regression analysis.
Q: You're a sociologist studying whether grocery prices are different in the inner cities than they are…
A: There are two independent samples which are SU and IC. We have to test whether inner city prices are…
Q: A set of n = 15 pairs of scores (X and Y values) produces a correlation of r = 0.30. If each of the…
A:
Q: 2. A meeting of envoys was attended by 4 Koreans and 2 Filipinos. If three envoys were selected at…
A: Here use concept of random variable
Q: A researcher were conducted in the effect of outdoor activity on mood. She hypotthesized that…
A: Given: Mode before Mode after 4 5 3 3 1 4 5 5 1 5 2 4 3 2 4 5 3 4 4 4…
Q: he graph shows the values I (in billions of dollars) of goods imported to the United States and the…
A: We have two series which represents the value of goods (in billion $) imported and exported from…
Q: 3. Osman plants 50 bean seeds and observes how many days it takes for each to germinate. He records…
A: Qualitative data: The data which cannot be expressed as numerically is called qualitative data.…
Q: Gestation and Average Longevity The data show the gestation period in days and the longevity of the…
A: The sample size n is 5. The correlation coefficient is 0.703.
Q: The amount of pollutants that are found in waterways near large cities is normally distributed with…
A: As per our guidelines we are supposed to answer only 3 subpart of any questions so i am solving…
Q: ams/Height in Meters“) of a healthy 5-year old got liberated from the Islamic State, the World Foe…
A: Given, sample size (n) = 225 sample mean (x̄) = 14.5785 sample standard deviation (s) = 2.25…
Q: Select all correct statements regarding the following McLeod-Li test chart. O o o O 10 15 20 25 Lag…
A:
Q: Help me solve this 17 parts remaining ne claim is that for 9 AM body temperatures of females, the…
A: Given that Sample size n =33 Population mean =98.6 Test statistic t= - 4.786
Q: According the World Health Organization, the Body Mass Index (BMI=Weight in Kilograms/Height in…
A: Answer:fail to reject null hypothesis(when only sample size =9 )


Trending now
This is a popular solution!

Step by step
Solved in 2 steps with 2 images

- Penicillin is produced by the Penicillin fungus, which is grown in a broth whose sugar content must be carefully controlled. Several samples of broth were taken on three successive days, and the amount of dissolved sugars, in milligrams per milliliter, was measured on each sample. The results were as follows. Day 1 : 4.9 5.4 5.3 4.9 5.2 5.1 5.4 4.9 5.1 5.1 4.9 5.4 Day 2 : 5.5 5.2 5.1 5.0 5.3 5.4 5.3 5.2 5.4 5.3 5.4 5.1 Day 3 : 5.8 5.0 5.4 5.5 5.5 5.5 4.8 5.5 5.2 4.9 5.5 5.0 Construct an ANOVA table. Round your answers to four decimal places as needed. One-way ANOVA: Sugar Concentration Source DF SS MS F P Days Error Total Is there enough evidence to conclude that the mean sugar concentration…What is E(x̄)? What is E(x̄) equal to?Suppose you take a random sample and find the sample mean, x̄. Based on the previous problem, can you say that x̄ is equal to the mean of the entire population µ?Step 2: Determine if r is statistically significant at 0.01 and 0.05 levels.
- The following data represent the yield on 30 consecutive batches of ceramic substrate to which a metal coating has been applied by a vapor-deposition process. a. Create a Histogram. b. What is the sample mean of the data? c. What is the sample standard deviation of the data? d. What is the skewness of the data (Pearson's first mode of coefficient)? What could you conclude? e. What is the kurtosis of the data? What could you conclude? (show solution)n a recent study, a scientist was interested in investigating whether there is a significant difference in the number of sleeping hours in different moon phases: waxing crescent, full moon, and waning crescent. Participants’ number hour of sleep were recorded in the table below. Quality of sleeps (in number of hours) Waxing Crescent Full Moon Waning Crescent 7 8 9 7 8 4 5 4 3 6 5 7 8 9 6 What is being measured? That is, what is the DV? What is the level of measurement of the DV? With α = .05, determine whether there are any significant mean differences among your groups.In a hypothetical scenario, the National Institute of Standards and Technology has received a new replica of The Kilogram. It is weighed five times. The measurements are as follows, in units of micro-grams above 1 kg: 114.3, 82.6, 136.4, 126.8, 100.7. a) Is it possible to estimate the uncertainty in these measurements? If so, estimate it. If not, explain why not. b) Is it possible to estimate the bias in these measurements? If so, estimate it. If not, explain why not.
- For an F ratio to be statistically significant, the between-groups mean square must beLife-saving drug: Penicillin is produced by the Penicillin fungus, which is grown in a broth whose sugar content must be carefully controlled. Several samples of broth were taken on three successive days, and the amount of dissolved sugars, in milligrams per milliliter, was measured on each sample. The results were as follows.(note: use mu for mean or average , p for proportion, >= for , <= for , =/ for ) State the null and alternative hypotheses to be used in testing the following claims and determine generally where the critical region is located: (a) The mean snowfall at Lake George during the month of February is 21.8 centimeters. Ho: Blank 1 H1: Blank 2 (b) No more than 20% of the faculty at the local university contributed to the annual giving fund. Ho: Blank 3 H1: Blank 4 (c) At least 70% of next year's new cars will be in the compact and subcompact category. Ho: Blank 5 H1: Blank 6 (d) The average rib-eye steak at the Longhorn Steak house is at least 340 grams. Ho: Blank 7 H1: Blank 8