C. Klein Inc. Income Statement For years ended December 31, 2017 and 2018 2018 $469,000 $422,000 303,000) (248,000) 166,000 174,000 2017 Sales (all on credit) Cost of goods sold Gross margin Depreciation expense Other operating 36,000 51,000 102,000 85,000 expenses Total operating 138,000 136,000 expenses Operating income 28,000 38,000 Other income (expenses) Interest expense (4,700) (3,500) Gain on sale of 4,900 3,400 investments Loss on sale of plant (2.100) (2,500) assets Total other income (expenses) (11,700) (2,600) Income before income 26,100 35,400 taxes Income taxes expense (7,830) (10,620 $18.270 $24780 Net income
C. Klein Inc. Income Statement For years ended December 31, 2017 and 2018 2018 $469,000 $422,000 303,000) (248,000) 166,000 174,000 2017 Sales (all on credit) Cost of goods sold Gross margin Depreciation expense Other operating 36,000 51,000 102,000 85,000 expenses Total operating 138,000 136,000 expenses Operating income 28,000 38,000 Other income (expenses) Interest expense (4,700) (3,500) Gain on sale of 4,900 3,400 investments Loss on sale of plant (2.100) (2,500) assets Total other income (expenses) (11,700) (2,600) Income before income 26,100 35,400 taxes Income taxes expense (7,830) (10,620 $18.270 $24780 Net income

Financial Reporting, Financial Statement Analysis and Valuation
8th Edition
ISBN:9781285190907
Author:James M. Wahlen, Stephen P. Baginski, Mark Bradshaw
Publisher:James M. Wahlen, Stephen P. Baginski, Mark Bradshaw
Chapter3: Income Flows Versus Cash Flows: Understanding The Statement Of Cash Flow
Section: Chapter Questions
Problem 1DIC

Related questions
Question
Transcribed Image Text:Cash Flows
from Oper
Horiz Analysis Horiz Analysis Vertic Analysis Vertic Analysis
Inc St
Ratios
Bal St
Inc St
Bal Sheet
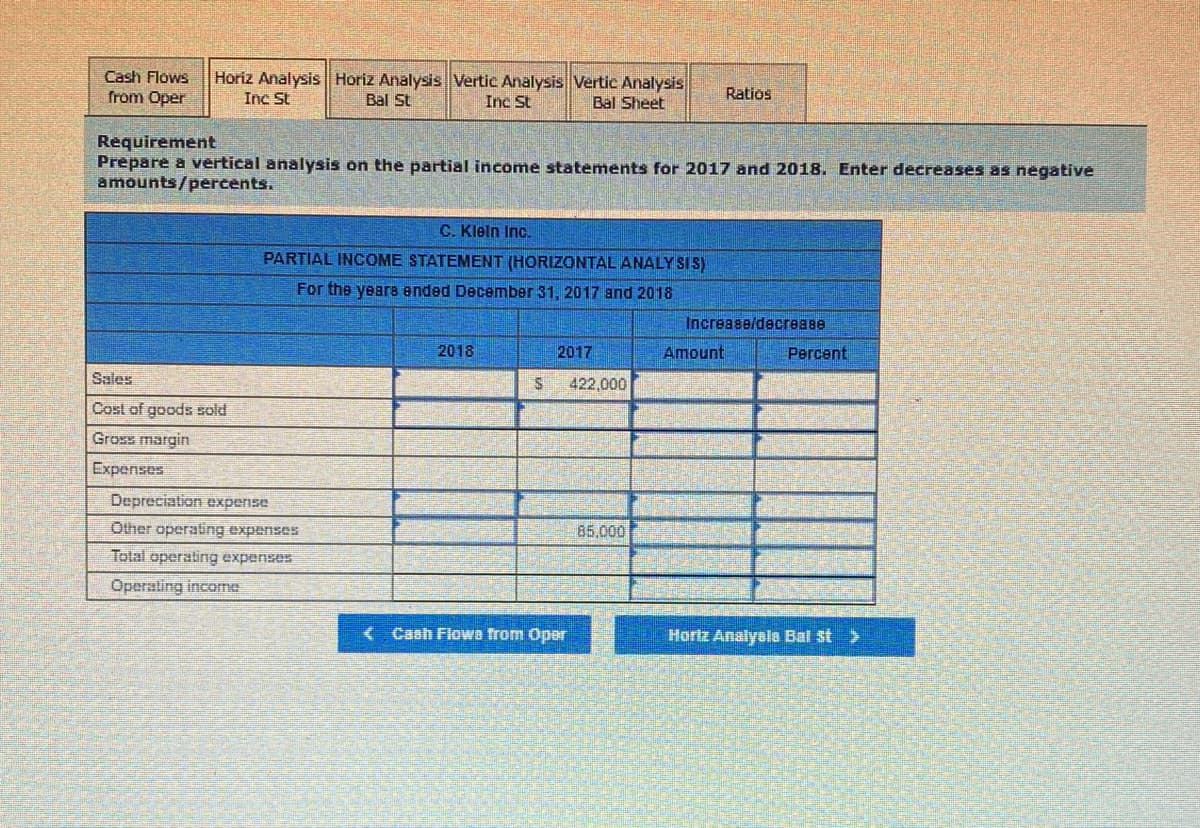
Requirement
Prepare a vertical analysis on the partial income statements for 2017 and 2018. Enter decreases as negative
amounts/percents.
C. Kleln Inc.
PARTIAL INCOME STATEMENT (HORIZONTAL ANALY SIS)
For the yeara ended December 31, 2017 and 2018
Increase/decrease
2018
2017
Amount
Percent
Sales
422,000
Cost of goods sold
Gross margin
Expenses
Depreciation expense
Other operating expenses
85,000
Total operating expenses
Operating income
< Cash Flowa from Oper
Horiz Analyala Bal st>
Transcribed Image Text:rehensive Problem 2- St of Cash Flows and Ratios Algo
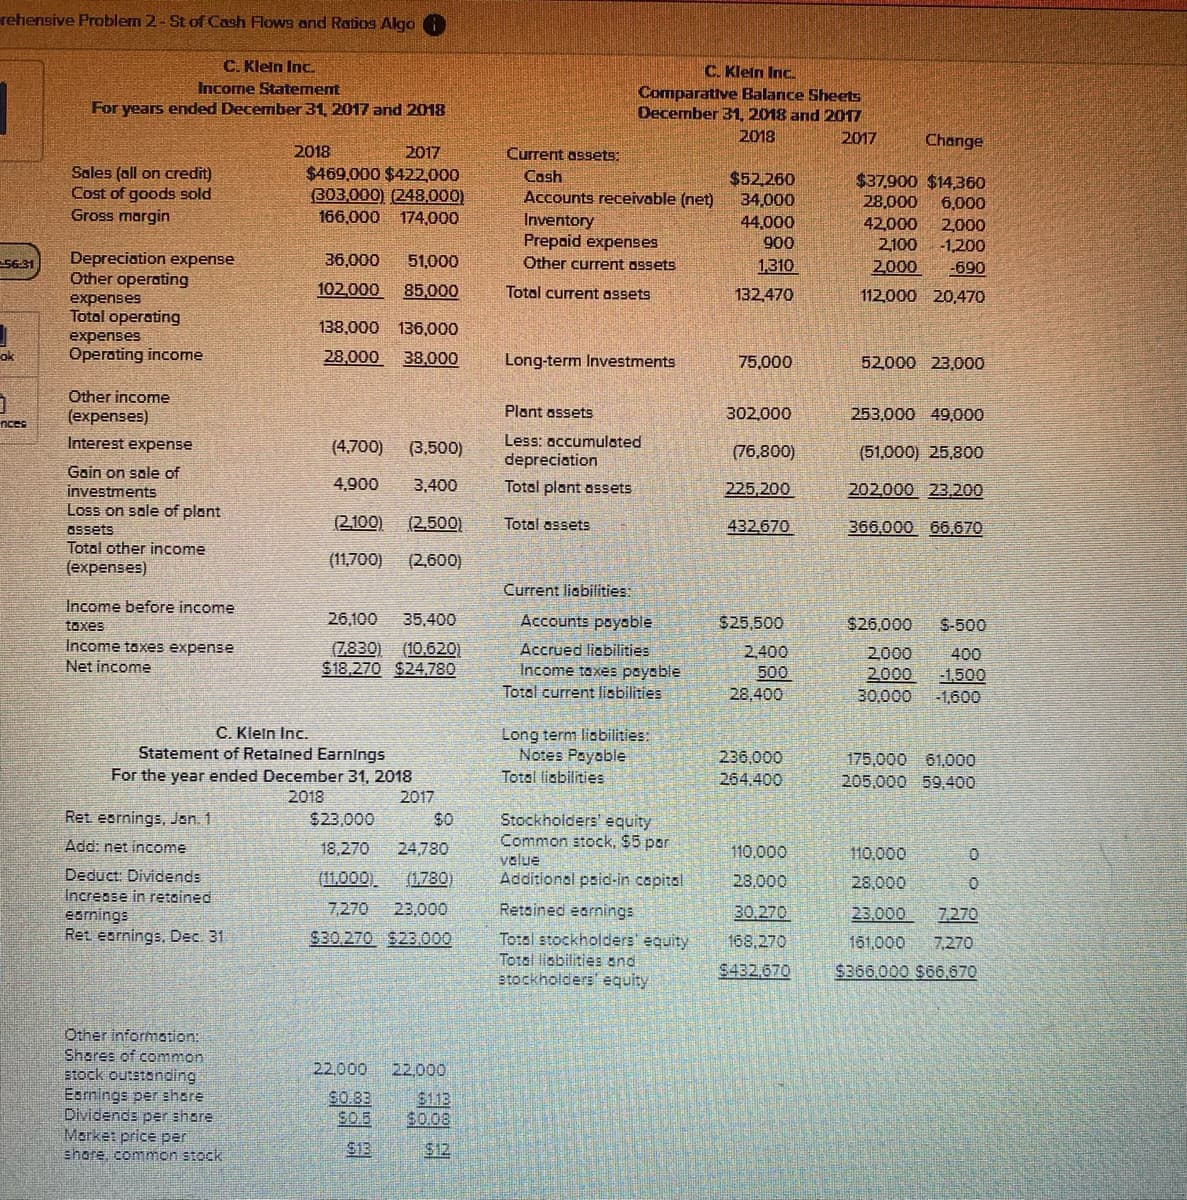
C. Klein Inc.
C. Klein Inc.
Income Statement
Comparative Balance Sheets
December 31, 2018 and 2017
For years ended December 31, 2017 and 2018
2018
2017
Change
2018
2017
$469,000 $422,000
(303,000) (248,000)
166,000 174,000
Current assets:
Sales (all on credit)
Cost of goods sold
Gross margin
Cash
$52.260
34,000
$37,900 $14,360
Accounts receivable (net)
28,000
6,000
Inventory
Prepaid expenses
44,000
42,000
2100
2,000
-1,200
900
Depreciation expense
Other operating
5631
36,000
51,000
Other current assets
1310
2000
-690
102,000
85,000
Totol current assets
132,470
112,000 20,470
expenses
Total operating
138,000 136,000
expenses
ok
Operating income
28.000
38,000
Long-term Investments
75,000
52,000 23,000
Other income
(expenses)
Plant assets
302,000
253,000 49,000
nces
Interest expense
(4,700)
(3,500)
Less: accumulated
(76,800)
(51,000) 25,800
depreciation
Gain on sale of
4,900
3,400
Total plant assets
225,200
202,000 23,200
investments
Loss on sale of plant
(2100)
(2.500)
Total assets
432670
366,000 66.670
Ossets
Total other income
(expenses)
(11,700)
(2,600)
Current liabilities:
Income before income
taxes
26,100
35.400
Accounts payeble
$25,500
$26,000
S-500
Income taxes expense
(7,830)
(10,620)
Accrued liabilities
2,400
500
28,400
2000
2000
30,000
400
Net income
$18,270 $24.780
Income taxes payable
Total current liobilities
-1.500
-1,600
C. Kleln Inc.
Statement of Retained Earnings
Long term liabilities:
Notes Payable
236,000
175,000 61.000
For the year ended December 31, 2018
Total lisbilities
264.400
205.000 59.400
2018
2017
Ret esrnings, Jan. 1
$0
Stockholders' equity
Common stock, $5 par
$23,000
Add: net income
18,270
24,780
110,000
110,000
value
Deduct: Dividends
Increose in retained
earnings
Ret eornings, Dec. 31
(11,000),
(1.780)
Additional paid-in capital
28,000
28,000
7.270
23,000
Retained earnings
30.270
23.000
7.270
Total stockholders' equity
Total liobilities and
stockholders' equity
$30.270 $23.000
168,270
161,000
7,270
$432.670
$366.000 $66,670
Other informotion:
Shares of common
stock outstonding
Eamings per share
Dividends per share
Market price per
shore, common stock
22,000
22,000
$0.83
S0.5
$113
$0.08
$13
$12
Expert Solution
This question has been solved!
Explore an expertly crafted, step-by-step solution for a thorough understanding of key concepts.

This is a popular solution!

Trending now
This is a popular solution!

Step by step
Solved in 2 steps with 1 images

Recommended textbooks for you
Financial Reporting, Financial Statement Analysis…
Finance
ISBN:
9781285190907
Author:
James M. Wahlen, Stephen P. Baginski, Mark Bradshaw
Publisher:
Cengage Learning


Survey of Accounting (Accounting I)
Accounting
ISBN:
9781305961883
Author:
Carl Warren
Publisher:
Cengage Learning
Financial Reporting, Financial Statement Analysis…
Finance
ISBN:
9781285190907
Author:
James M. Wahlen, Stephen P. Baginski, Mark Bradshaw
Publisher:
Cengage Learning
Survey of Accounting (Accounting I)
Accounting
ISBN:
9781305961883
Author:
Carl Warren
Publisher:
Cengage Learning

Corporate Financial Accounting
Accounting
ISBN:
9781305653535
Author:
Carl Warren, James M. Reeve, Jonathan Duchac
Publisher:
Cengage Learning

Financial & Managerial Accounting
Accounting
ISBN:
9781337119207
Author:
Carl Warren, James M. Reeve, Jonathan Duchac
Publisher:
Cengage Learning

Cornerstones of Financial Accounting
Accounting
ISBN:
9781337690881
Author:
Jay Rich, Jeff Jones
Publisher:
Cengage Learning