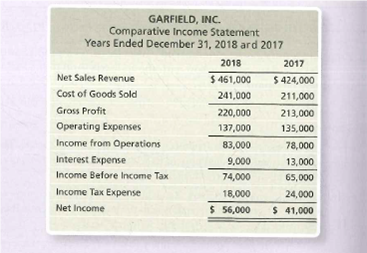
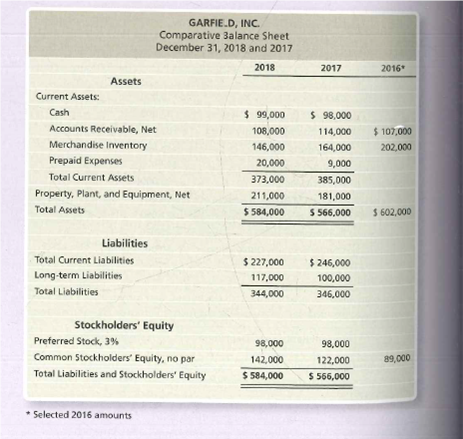
GARFIELD, INC. Comparative Income Statement Years Ended December 31, 2018 ard 2017 2018 2017 Net Sales Revenue $ 461,000 $ 424,000 Cost of Goods Sold 241,000 211,000 Gross Profit 220,000 213,000 Operating Expenses 137,000 135,000 Income from Operations 83,000 78,000 Interest Expense 9,000 13,000 Income Before Income Tax 74,000 65,000 Income Tax Eхрепse 18,000 24,000 Net Income $ 56,000 $ 41,000 GARFIE.D, INC. Comparative 3alance Sheet December 31, 2018 and 2017 2018 2017 2016* Assets Current Assets: Cash $ 99,000 $ 98,000 Accounts Receivable, Net 108,000 114,000 $ 107,000 Merchandise Inventory 146,000 164,000 202,000 Prepaid Expenses 20,000 9,000 Total Current Assets 373,000 385,000 Property, Plant, and Equipment, Net 211,000 181,000 Total Assets $ 584,000 5 566,000 $ 602,000 Liabilities Total Current Liabilities $ 227,000 $ 246,000 Long-term Liabilities 117,000 100,000 Total Liabilities 344,000 346,000 Stockholders' Equity Preferred Stock, 3% 98,000 98,000 Common Stockholders' Equity, no par 142,000 122,000 89,000 Total Liabilities and Stockholders' Equity $ 584,000 $ 566,000 Selected 2016 amounts
GARFIELD, INC. Comparative Income Statement Years Ended December 31, 2018 ard 2017 2018 2017 Net Sales Revenue $ 461,000 $ 424,000 Cost of Goods Sold 241,000 211,000 Gross Profit 220,000 213,000 Operating Expenses 137,000 135,000 Income from Operations 83,000 78,000 Interest Expense 9,000 13,000 Income Before Income Tax 74,000 65,000 Income Tax Eхрепse 18,000 24,000 Net Income $ 56,000 $ 41,000 GARFIE.D, INC. Comparative 3alance Sheet December 31, 2018 and 2017 2018 2017 2016* Assets Current Assets: Cash $ 99,000 $ 98,000 Accounts Receivable, Net 108,000 114,000 $ 107,000 Merchandise Inventory 146,000 164,000 202,000 Prepaid Expenses 20,000 9,000 Total Current Assets 373,000 385,000 Property, Plant, and Equipment, Net 211,000 181,000 Total Assets $ 584,000 5 566,000 $ 602,000 Liabilities Total Current Liabilities $ 227,000 $ 246,000 Long-term Liabilities 117,000 100,000 Total Liabilities 344,000 346,000 Stockholders' Equity Preferred Stock, 3% 98,000 98,000 Common Stockholders' Equity, no par 142,000 122,000 89,000 Total Liabilities and Stockholders' Equity $ 584,000 $ 566,000 Selected 2016 amounts

Survey of Accounting (Accounting I)
8th Edition
ISBN:9781305961883
Author:Carl Warren
Publisher:Carl Warren
Chapter9: Metric-analysis Of Financial Statements
Section: Chapter Questions
Problem 9.4.14P: Twenty metrics of liquidity, solvency, and profitability The comparative financial statements of...

Related questions
Question
Using ratios to evaluate a stock investment
Comparative financial statement data of Garfield Inc. follow:
- Market price of Garfield’s common stock:$69.36 at December 31 2018 and $38.04 at December 31, 2017.
- Common shares outstanding 14, 000 on December 31, 2018 and 12,000 on December 31 2017 and 2016.
- All sales are on credit.
Requirements
- Compute the following ratios tor 2018 and 2017:
a.
b. Cash ratio
c. Times-interest-earned ratio
d. Inventory turnover
e. Gross profit percentage
f. Debt to equity ratio
g.
h. Earnings per share of common stock
i. Price/earnings ratio
2. Decide (a) whether Garfield’s ability to pat debts and to sell inventory improved or deteriorated during 2018 and (b) whether the investment attractiveness of its common stock appears to have increased or decreased.
Transcribed Image Text:GARFIELD, INC.
Comparative Income Statement
Years Ended December 31, 2018 ard 2017
2018
2017
Net Sales Revenue
$ 461,000
$ 424,000
Cost of Goods Sold
241,000
211,000
Gross Profit
220,000
213,000
Operating Expenses
137,000
135,000
Income from Operations
83,000
78,000
Interest Expense
9,000
13,000
Income Before Income Tax
74,000
65,000
Income Tax Eхрепse
18,000
24,000
Net Income
$ 56,000
$ 41,000
Transcribed Image Text:GARFIE.D, INC.
Comparative 3alance Sheet
December 31, 2018 and 2017
2018
2017
2016*
Assets
Current Assets:
Cash
$ 99,000
$ 98,000
Accounts Receivable, Net
108,000
114,000
$ 107,000
Merchandise Inventory
146,000
164,000
202,000
Prepaid Expenses
20,000
9,000
Total Current Assets
373,000
385,000
Property, Plant, and Equipment, Net
211,000
181,000
Total Assets
$ 584,000
5 566,000
$ 602,000
Liabilities
Total Current Liabilities
$ 227,000
$ 246,000
Long-term Liabilities
117,000
100,000
Total Liabilities
344,000
346,000
Stockholders' Equity
Preferred Stock, 3%
98,000
98,000
Common Stockholders' Equity, no par
142,000
122,000
89,000
Total Liabilities and Stockholders' Equity
$ 584,000
$ 566,000
Selected 2016 amounts
Expert Solution


Trending now
This is a popular solution!

Step by step
Solved in 10 steps with 4 images

Knowledge Booster


Learn more about
Need a deep-dive on the concept behind this application? Look no further. Learn more about this topic, accounting and related others by exploring similar questions and additional content below.Recommended textbooks for you
Survey of Accounting (Accounting I)
Accounting
ISBN:
9781305961883
Author:
Carl Warren
Publisher:
Cengage Learning

Cornerstones of Financial Accounting
Accounting
ISBN:
9781337690881
Author:
Jay Rich, Jeff Jones
Publisher:
Cengage Learning

Financial Accounting: The Impact on Decision Make…
Accounting
ISBN:
9781305654174
Author:
Gary A. Porter, Curtis L. Norton
Publisher:
Cengage Learning
Survey of Accounting (Accounting I)
Accounting
ISBN:
9781305961883
Author:
Carl Warren
Publisher:
Cengage Learning
Cornerstones of Financial Accounting
Accounting
ISBN:
9781337690881
Author:
Jay Rich, Jeff Jones
Publisher:
Cengage Learning
Financial Accounting: The Impact on Decision Make…
Accounting
ISBN:
9781305654174
Author:
Gary A. Porter, Curtis L. Norton
Publisher:
Cengage Learning

Financial & Managerial Accounting
Accounting
ISBN:
9781285866307
Author:
Carl Warren, James M. Reeve, Jonathan Duchac
Publisher:
Cengage Learning

Intermediate Accounting: Reporting And Analysis
Accounting
ISBN:
9781337788281
Author:
James M. Wahlen, Jefferson P. Jones, Donald Pagach
Publisher:
Cengage Learning

Fundamentals of Financial Management (MindTap Cou…
Finance
ISBN:
9781337395250
Author:
Eugene F. Brigham, Joel F. Houston
Publisher:
Cengage Learning