C12. According to the same National Collegiate Athletic Association data, the means and standard deviations of eligibility and retention rates (based on a 1,000-point scale) for rhe 2013-2014 academic year are presented, along with the fictional scores for two hasketball teams, A and B. Assume that rates are normally distributed. Mean Standard Deviation Team A Team B Eligibility 983 33 971 987 Retention 976 34.9 958 970 a. On which criterion (eligibility or retention) did Team A do better than Team B? Calculate appropriate statistics to answer this question. b. What proportion of the teams have retention rates below Team B? c. What is the percentile rank of Team A's eligibility rate?
C12. According to the same National Collegiate Athletic Association data, the means and standard deviations of eligibility and retention rates (based on a 1,000-point scale) for rhe 2013-2014 academic year are presented, along with the fictional scores for two hasketball teams, A and B. Assume that rates are normally distributed. Mean Standard Deviation Team A Team B Eligibility 983 33 971 987 Retention 976 34.9 958 970 a. On which criterion (eligibility or retention) did Team A do better than Team B? Calculate appropriate statistics to answer this question. b. What proportion of the teams have retention rates below Team B? c. What is the percentile rank of Team A's eligibility rate?

Glencoe Algebra 1, Student Edition, 9780079039897, 0079039898, 2018
18th Edition
ISBN:9780079039897
Author:Carter
Publisher:Carter
Chapter10: Statistics
Section10.4: Distributions Of Data
Problem 19PFA

Related questions

Question
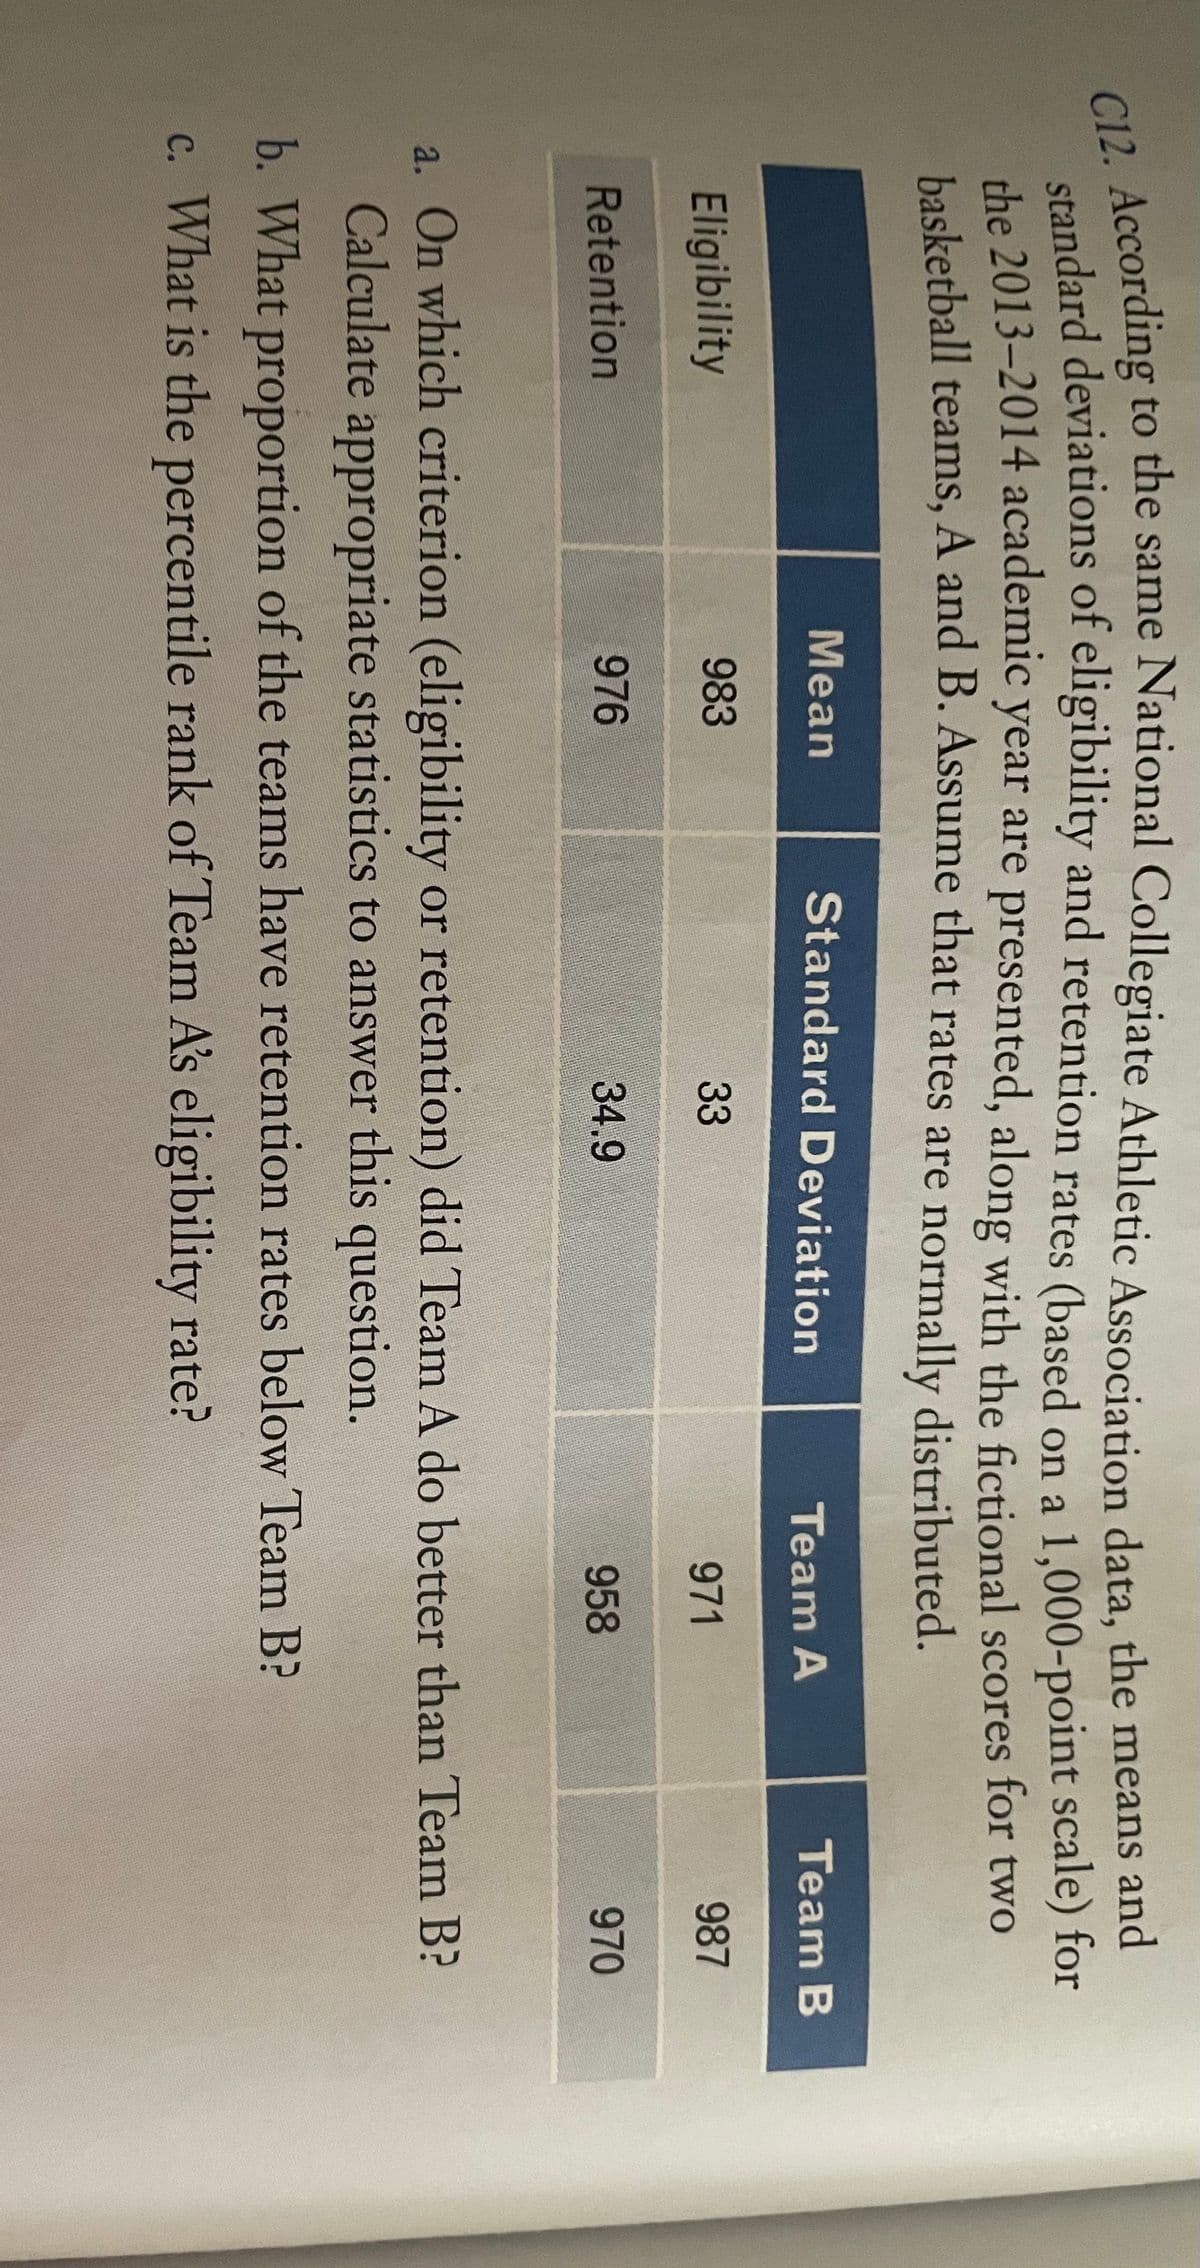
Transcribed Image Text:a According to the same National Collegiate Athletic Association data, the means and
ctandard deviations of eligibility and retention rates (based on a 1.000-point scale) for
the 2013-2014 academic year are presented, along with the fictional scores for two
basketball teams, A and B. Assume that rates are normally distributed.
Mean
Standard Deviation
Team A
Team B
Eligibility
983
33
971
987
Retention
976
34.9
958
970
a. On which criterion (eligibility or retention) did Team A do better than Team B?
Calculate appropriate statistics to answer this question.
b. What proportion of the teams have retention rates below Team B?
c. What is the percentile rank of Team A's eligibility rate?
Expert Solution
This question has been solved!
Explore an expertly crafted, step-by-step solution for a thorough understanding of key concepts.

This is a popular solution!

Trending now
This is a popular solution!

Step by step
Solved in 2 steps

Knowledge Booster


Learn more about
Need a deep-dive on the concept behind this application? Look no further. Learn more about this topic, statistics and related others by exploring similar questions and additional content below.Recommended textbooks for you
Glencoe Algebra 1, Student Edition, 9780079039897…
Algebra
ISBN:
9780079039897
Author:
Carter
Publisher:
McGraw Hill
Glencoe Algebra 1, Student Edition, 9780079039897…
Algebra
ISBN:
9780079039897
Author:
Carter
Publisher:
McGraw Hill