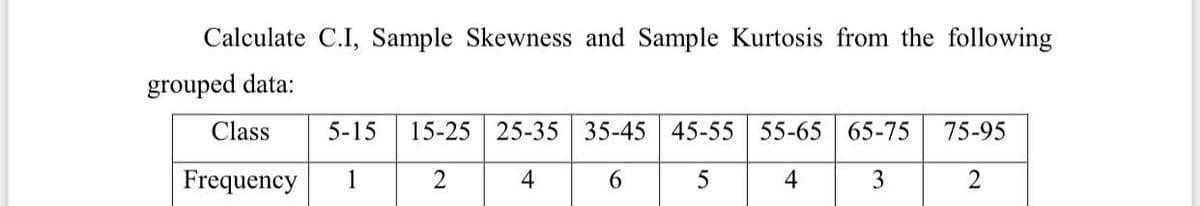
Calculate C.I, Sample Skewness and Sample Kurtosis from the following grouped data: Class 5-15 15-25 25-35 35-45 45-55 55-65 65-75 75-95 Frequency 1 4 6. 4 3 2


Q: 1. The scores of ten students in a 30-item test are listed below 25 19 15 22 28 20 22 21 26 16 Put…
A: As per Bartleby guideline expert have to answer first question three subparts only dear student…
Q: Explain the following terms a) Multi-phase sampling b) Multi-stage sampling c) Sampling frame
A: (a) Multiphase sampling: This sampling technique is used when there is a need of controlling the…
Q: Wild irises are beautiful flowers found throughout the United States, Canada, and northern Europe.…
A: Since you have posted a question with multiple sub-parts, we will solve first three sub-parts for…
Q: Wild irises are beautiful flowers found throughout the United States, Canada, and northern Europe.…
A: Given: Measurements of sepal length in centimetres from random samples of Iris setose (I), Iris…
Q: As part of a pilot study aimed at determining the daily consumption of water (in litres) across…
A:
Q: 3. The measured soil water content of 16 samples at four depths is as follows: Soil Water contents (…
A:
Q: The spike stature of the plants grown from the seeds of the porcine separates (Dactylis glomerata L)…
A: Given nX=11, nY=10 X (x-x__)2 Y (y-y__)2 5 1 12 3.61 6 0 9 1.21 8 4 11 0.81 7 1 9 1.21…
Q: The number of contaminating particles on a silicon waferprior to a certain rinsing process was…
A:
Q: 6. 8. 9. 10 11 12 13 Number of Pairs of Shoes of the distribution. number of pairs of shoes in the…
A: Distributions of data can have few or many peaks. Distributions with one clear peak are called…
Q: 1. Using the above data we obtain the following descriptive statistics Deaths PCRTests Admissions…
A: As per guidelines, we will only answer first three subparts. a) Daily mean deaths in the UK over…
Q: a. An experiment to compare the tension bond strength of polymer lates modified mortar to that of…
A: Following are the Explanation of the question Use the Two sample Z test to Compare the two groups of…
Q: Given the linear correlation coefficient r and the sample size n, determine the critical values of r…
A: DF = n-2 = 5-2 = 3 The critical values are -0.878 and 0.878. Decision Rule : Reject H0 if r is not…
Q: Consider the data set given below, and 1. Find the mean, variance, Skewness measure and Kurtosis…
A: In the given case, 6 data sets are available of equal size for which we are supposed to obtain the…
Q: Three EV (Electric Vehicle) motor systems are being tested for their efficiency. The following are…
A: Null Hypothesis: H0: There is no difference in the means among the three groups. Alternative…
Q: Given the linear correl ation coefficient r and the sample size n, determine the critical values of…
A: Given : r = -0.466 n = 15
Q: Two samples A and B were taken from a large concrete mix and tested for the compressive strength of…
A: The basic concept of statistic s is a measure of central tendency. Central tendency gives a single…
Q: The better-selling candies are often high in calories. Assume that the following data show the…
A: Given Information: The data represents the calorie content from samples of M&M's, kit Kat and…
Q: the yields of a genetically-modifed wheat in bushets per acrei were compared tor thve different…
A: The Given data is, Variety 1 2 3 4 5 6 A 35.3 31 32.7 36.8 37.2 33.1 B 30.7 32.2 31.4 31.7…
Q: a) Use a calculator with mean and standard deviation keys to calculate x1, s1, x2, and s2. (Round…
A: (a) We can use calculator or Excel to calculate the required values. Pasting the values in Excel and…
Q: 4. Use the data provided in Table 1 to answer questions 4(a)-4(e): Table 1. Seaweed (Ulva) biomass…
A: Since you have posted a question with multiple sub parts, according to our guidelines we can solve…
Q: Wild irises are beautiful flowers found throughout the United States, Canada, and northern Europe.…
A: The null and the alternative hypotheses are;Null hypothesis: All means of sepal length of different…
Q: In a Nicd battery, a fully charged cell is composed of nickelic hydroxide. Nickel is an element that…
A: Given data: To Determine: Mean and variance of the nickel charge.
Q: Interpret the results presented in the following table. Table 2: Descriptive Analysis Cronbach Mean…
A: Skewness: If the value of skewness is equal to zero then the distribution is normal and symmetric.…
Q: Consider the following data: x −4−4 −3−3 −2−2 −1−1 00 P(X=x)P(X=x) 0.30.3 0.10.1 0.20.2 0.20.2…
A:
Q: An article in the IEEE Transactions on Components, Hybrids, and Manufacturing Technology (Vol. 15,…
A:
Q: The following data summarize the results from an independent-measures study comparing three…
A: Note: You have posted the same question in both 1 and 2. we will answer the question. 2) Sample…
Q: The yields of a genetically-modified whieat in bushels per acre) were compared for five different…
A: The given data is the, Variety 1 2 3 4 5 A 35.3 31 32.7 36.8 37.2 B 30.7 32.2 31.4 31.7 35…
Q: Exposure to microbial products, especially endotoxin, may have an impact on vulnerability to…
A: Mean is calculate by adding all the observation in the sample divide by the sample size. It provide…
Q: An artidle in the IEEE Transactions on Components, Hybrids, and Manufacturing Technolo experiment in…
A: By using one way ANOVA for a single factor,
Q: Traffic accidents: Traffic engineers compared rates of traffic accidents at intersections with…
A:
Q: Wild irises are beautiful flowers found throughout the United States, Canada, and northern Europe.…
A: Given Information : Wild irises are beautiful flowers found throughout the United States, Canada,…
Q: 1. Determine the degree of skewness and kurtosis of the following sets of data: a. Anxiety Level of…
A:
Q: b) The data in table 4b below gives the number of nonconforming bearings and seal assemblies in a…
A:
Q: Exposure to microbial products, especially endotoxin, may have an impact on vulnerability to…
A:
Q: Histogram: fines paid by drivers 12 10 4. 1 2 3 More Number of fines paid a year by a driver Compute…
A:
Q: Following are the protein contents measured in two types of species: Species 1: 0.72 1.12 0.81 0.89…
A: Given data is appropriate for testing of hypothesis to test t-test for difference of means. Because…
Q: Wild irises are beautiful flowers found throughout the United States, Canada, and northern Europe.…
A: Given Information : Wild irises are beautiful flowers found throughout the United States, Canada,…
Q: Find Karl Pearson's coefficient of Skewness from the data: 1,5, 4, 6, 4, 10
A: Given data is1,5,4,6,4,10
Q: Table Q3(a) Impact test results of a sample preparation of sisal polypropylene composite S S f S S S…
A: Hello! As you have posted 2 different questions, we are answering the first question. In case you…
Q: In a study of factors thought to be responsible for the adverse effects of smoking on human…
A: Introduction: Denote μ1, μ2 as the true population mean cadmium levels (nanograms per gram) in…
Q: In an investigation of the visual scanning behaviour of deaf children, measurements of eye movement…
A: Given Deaf children Normal children 1.81 0.95 2.2 1.49 3.29 1.12 2.13 1.07 2.55 1…
Q: 6.4.10. In a study of factors thought to be responsible for the adverse effects of smoking on human…
A: Given information: A study to study the factors which are responsible for the adverse effects of…
Q: Wild irises are beautiful flowers found throughout the United States, Canada, and northern Europe.…
A: Given information- Measurements of sepal length in centimeters from random samples of Iris setosa…
Q: For the 25 drives made with the new balls. (a) calculate statistics that you think would be…
A: Descriptive Statistics corresponds to measures and charts that are derived from the sample and are…
Q: The Goodman Tire and Rubber Company periodically tests its tires for tread wear under simulated road…
A: Given: Sample Size n=3 Number of Sample k=20
Q: The following data represent soil water content (percent water by volume) for independent random…
A: The given information is the soil water content for the two independent random samples of soil taken…
Q: State whether the effect size for a 1-point effect (M- = 1) is small, medium or large given the…
A: Effect size is: Effect size=M-μσ=1σ
Q: a. Determine the three quartile values for blood cocaine concentration for both ED and Non-ED…
A: Solution: From the given data, a) Determine the four quartile values for blood cocaine concentration…
Q: The data to the right are from independent simple random samples from three populations. Determine…
A: There are 3 independent samples which are sample 1, sample 2 and sample 3. The samples follow normal…
Q: The following data represent soil water content (percent water by volume) for independent random…
A: The given information is the soil water content for the two independent random samples of soil taken…

Step by step
Solved in 3 steps with 3 images

- Mendel counted 4000 peas from a dihybrid cross and predicted a 9:3:3:1 phenotypic ratio with the following results. Yellow and smooth peas 2100; yellow and wrinkled peas 700: green and smooth peas 859 and green and wrinkled peas 341. Support or refute these data with a CHI-Square analysis. State the Null hypothesis and its outcome for this set of data.A paper investigated the driving behavior of teenagers by observing their vehicles as they left a high school parking lot and then again at a site approximately 1 2 mile from the school. Assume that it is reasonable to regard the teen drivers in this study as representative of the population of teen drivers. MaleDriver FemaleDriver 1.4 -0.2 1.2 0.5 0.9 1.1 2.1 0.7 0.7 1.1 1.3 1.2 3 0.1 1.3 0.9 0.6 0.5 2.1 0.5 (a) Use a .01 level of significance for any hypothesis tests. Data consistent with summary quantities appearing in the paper are given in the table. The measurements represent the difference between the observed vehicle speed and the posted speed limit (in miles per hour) for a sample of male teenage drivers and a sample of female teenage drivers. (Use ?males − ?females. Round your test statistic to two decimal places. Round your degrees of freedom down to the nearest whole number. Round your p-value to three decimal places.) t = df =…The spike stature of the plants grown from the seeds of the porcine separates (Dactylis glomerata L) collected from the University campus and İbradı Eynif pasture are given below. In this plant, compare whether there is a difference between regions in terms of spike height. Virgo Height (cm) Data obtained from plants collected from university campus 5 6 8 7 8 6 5 5 4 6 6 Data obtained from plants collected from Eynif pasture 12 9 11 9 9 11 9 10 11 10 Note: Your results interpretation according to two different possibilities (Do it separately, assuming that it is 0.07 and 0.04).
- A paper investigated the driving behavior of teenagers by observing their vehicles as they left a high school parking lot and then again at a site approximately 1 2 mile from the school. Assume that it is reasonable to regard the teen drivers in this study as representative of the population of teen drivers. MaleDriver FemaleDriver 1.3 -0.3 1.3 0.6 0.9 1.1 2.1 0.7 0.7 1.1 1.3 1.2 3 0.1 1.3 0.9 0.6 0.5 2.1 0.5 (a) Use a .01 level of significance for any hypothesis tests. Data consistent with summary quantities appearing in the paper are given in the table. The measurements represent the difference between the observed vehicle speed and the posted speed limit (in miles per hour) for a sample of male teenage drivers and a sample of female teenage drivers. (Use ?males − ?females. Round your test statistic to two decimal places. Round your degrees of freedom down to the nearest whole number. Round your p-value to three decimal places.) t = df =…The number of contaminating particles on a silicon waferprior to a certain rinsing process was determined for eachwafer in a sample of size 100, resulting in the followingfrequencies:Number of particles 0 1 2 3 4 5 6 7Frequency 1 2 3 12 11 15 18 10Number of particles 8 9 10 11 12 13 14Frequency 12 4 5 3 1 2 1a. What proportion of the sampled wafers had at leastone particle? At least five particles?b. What proportion of the sampled wafers had betweenfive and ten particles, inclusive? Strictly between fiveand ten particles?c. Draw a histogram using relative frequency on thevertical axis. How would you describe the shape of thehistogram?Find the t value that forms the boundary of the criticalregion in the right-hand tail for a one-tailed test witha = .01 for each of the following sample sizes.a. n = 10b. n = 20c. n = 30
- A group of high-risk automobile drivers (with three moving violations in one year) are required, according to random assignment, either to attend a traffic school or to perform supervised volunteer work. During the subsequent five-year period, these same drivers were cited for the following number of moving violations: NUMBER OF MOVING VIOLATIONS TRAFFIC SCHOOL VOLUNTEER WORK 0 26 0 7 15 4 9 1 7 1 0 14 2 6 23 10 7 8 Why might the Mann–Whitney U test be preferred to the t test for these data? Use U to test the null hypothesis at the .05 level of significance. Specify the approximate p-value for this test result.Refer to Exercise 8.S.6. Analyze these data using a Wilcoxon signed-rank test.A paper investigated the driving behavior of teenagers by observing their vehicles as they left a high school parking lot and then again at a site approximately 1 2 mile from the school. Assume that it is reasonable to regard the teen drivers in this study as representative of the population of teen drivers. Amount by Which Speed Limit Was Exceeded MaleDriver FemaleDriver 1.2 -0.1 1.4 0.4 0.9 1.1 2.1 0.7 0.7 1.1 1.3 1.2 3 0.1 1.3 0.9 0.6 0.5 2.1 0.5 (a) Use a .01 level of significance for any hypothesis tests. Data consistent with summary quantities appearing in the paper are given in the table. The measurements represent the difference between the observed vehicle speed and the posted speed limit (in miles per hour) for a sample of male teenage drivers and a sample of female teenage drivers. (Use μmales − μfemales.Round your test statistic to two decimal places. Round your degrees of freedom down to the nearest whole number. Round your p-value to…
- A paper investigated the driving behavior of teenagers by observing their vehicles as they left a high school parking lot and then again at a site approximately 1 2 mile from the school. Assume that it is reasonable to regard the teen drivers in this study as representative of the population of teen drivers. Amount by Which Speed Limit Was Exceeded MaleDriver FemaleDriver 1.3 -0.1 1.3 0.4 0.9 1.1 2.1 0.7 0.7 1.1 1.3 1.2 3 0.1 1.3 0.9 0.6 0.5 2.1 0.5 (a) Use a .01 level of significance for any hypothesis tests. Data consistent with summary quantities appearing in the paper are given in the table. The measurements represent the difference between the observed vehicle speed and the posted speed limit (in miles per hour) for a sample of male teenage drivers and a sample of female teenage drivers. (Use μmales − μfemales.Round your test statistic to two decimal places. Round your degrees of freedom down to the nearest whole number. Round your p-value to…Following are the protein contents measured in two types of species:Species 1: 0.72 1.12 0.81 0.89 0.72 0.81 1.01 0.75 0.83Species 2: 1.21 0.93 0.80 1.12 1.22 0.94 0.87 i) Assuming normality, test the hypothesis that the two species have the sameaverage protein contents by using 5-step hypothesis testing procedure at 5 %level of significance, and using the critical values approach.ii) Calculate the p-value of this test and make decision.iii) Write down the standard error of this test and calculate its numerical value ?A sample of men and women who had passed their driver's test either the first time or the second time were surveyed, with the following results: Results of the driving testGender First time Second timeMen 126 211Women 135 178a) Do these data suggest that there is a relationship between gender and the passing of their driver’s test from which the present sample was drawn? Let alpha=.05


