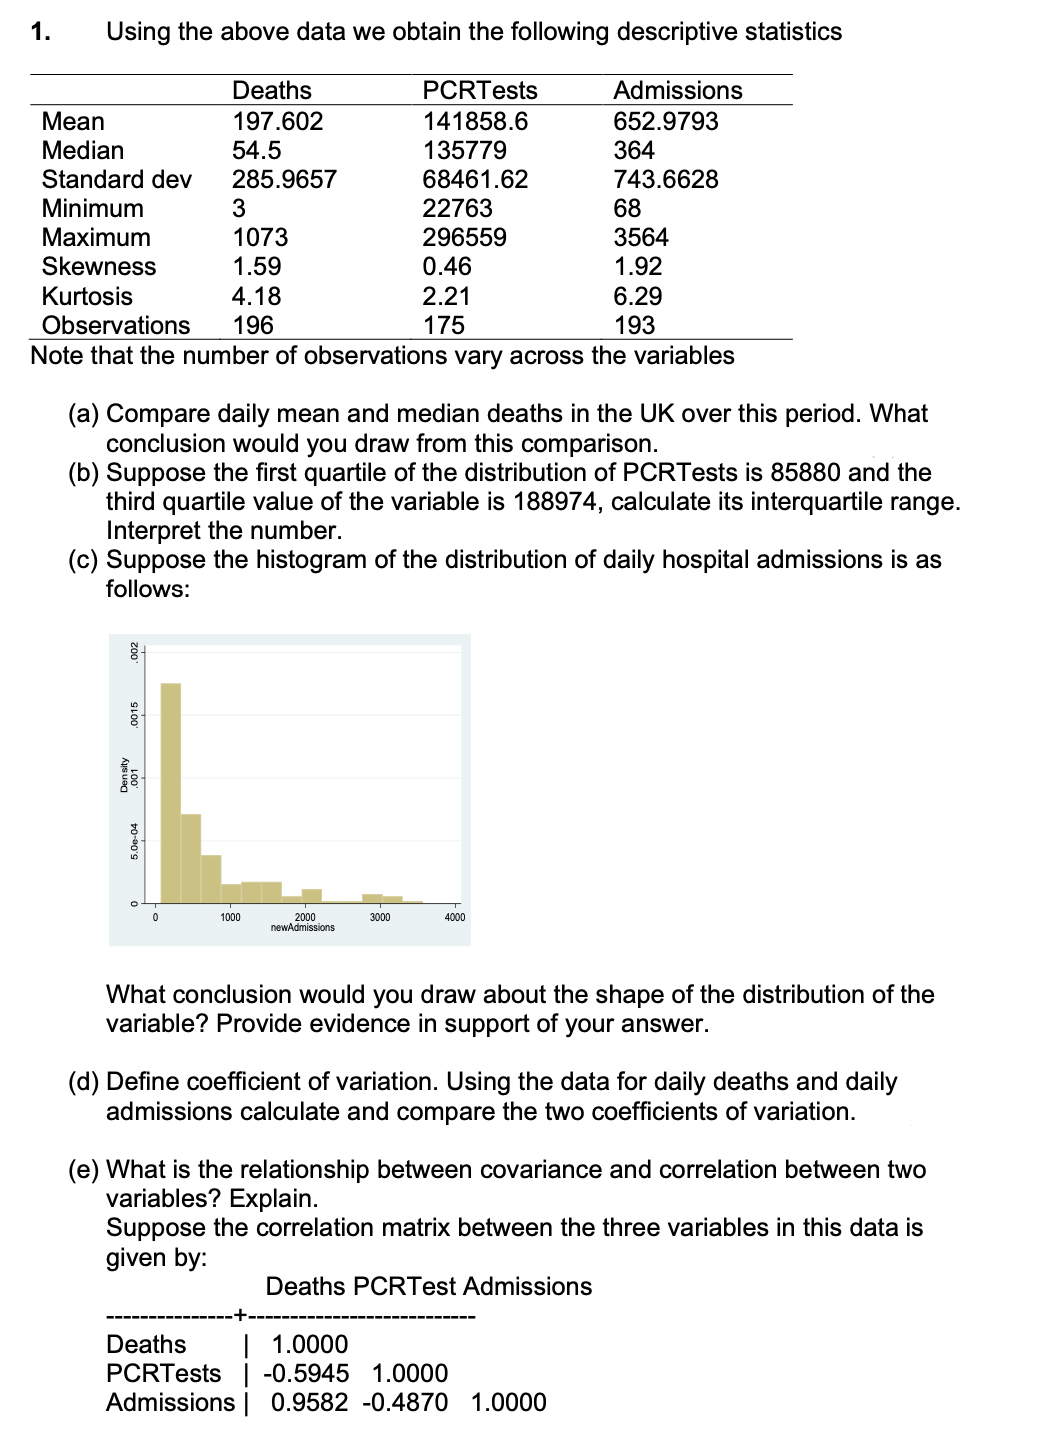
1. Using the above data we obtain the following descriptive statistics Deaths PCRTests Admissions 197.602 141858.6 135779 68461.62 22763 296559 0.46 Мean 652.9793 Median Standard dev Minimum 54.5 364 285.9657 743.6628 68 3564 1.92 Maximum 1073 Skewness Kurtosis Observations 1.59 4.18 2.21 6.29 196 175 193 Note that the number of observations vary across the variables (a) Compare daily mean and median deaths in the UK over this period. What conclusion would you draw from this comparison. (b) Suppose the first quartile of the distribution of PCRTests is 85880 and the third quartile value of the variable is 188974, calculate its interquartile range. Interpret the number. (c) Suppose the histogram of the distribution of daily hospital admissions is as follows: 2000 newAdmissions 1000 3000 4000 What conclusion would you draw about the shape of the distribution of the variable? Provide evidence in support of your answer.
1. Using the above data we obtain the following descriptive statistics Deaths PCRTests Admissions 197.602 141858.6 135779 68461.62 22763 296559 0.46 Мean 652.9793 Median Standard dev Minimum 54.5 364 285.9657 743.6628 68 3564 1.92 Maximum 1073 Skewness Kurtosis Observations 1.59 4.18 2.21 6.29 196 175 193 Note that the number of observations vary across the variables (a) Compare daily mean and median deaths in the UK over this period. What conclusion would you draw from this comparison. (b) Suppose the first quartile of the distribution of PCRTests is 85880 and the third quartile value of the variable is 188974, calculate its interquartile range. Interpret the number. (c) Suppose the histogram of the distribution of daily hospital admissions is as follows: 2000 newAdmissions 1000 3000 4000 What conclusion would you draw about the shape of the distribution of the variable? Provide evidence in support of your answer.

Big Ideas Math A Bridge To Success Algebra 1: Student Edition 2015
1st Edition
ISBN:9781680331141
Author:HOUGHTON MIFFLIN HARCOURT
Publisher:HOUGHTON MIFFLIN HARCOURT
Chapter9: Solving Quadratic Functions
Section: Chapter Questions
Problem 4CA

Related questions
Topic Video
Question
question in images
Transcribed Image Text:1.
Using the above data we obtain the following descriptive statistics
EFFE
Deaths
PCRTests
Admissions
Мean
197.602
141858.6
652.9793
Median
Standard dev
Minimum
135779
68461.62
54.5
364
743.6628
285.9657
22763
296559
68
3564
Maximum
1073
Skewness
1.59
0.46
1.92
Kurtosis
4.18
196
2.21
175
6.29
193
Observations
Note that the number of observations vary across the variables
(a) Compare daily mean and median deaths in the UK over this period. What
conclusion would you draw from this comparison.
(b) Suppose the first quartile of the distribution of PCRTests is 85880 and the
third quartile value of the variable is 188974, calculate its interquartile range.
Interpret the number.
(c) Suppose the histogram of the distribution of daily hospital admissions is as
follows:
1000
2000
newAdmissions
3000
4000
What conclusion would you draw about the shape of the distribution of the
variable? Provide evidence in support of
your answer.
(d) Define coefficient of variation. Using the data for daily deaths and daily
admissions calculate and compare the two coefficients of variation.
(e) What is the relationship between covariance and correlation between two
variables? Explain.
Suppose the correlation matrix between the three variables in this data is
given by:
Deaths PCRTest Admissions
| 1.0000
PCRTests | -0.5945 1.0000
Admissions | 0.9582 -0.4870 1.0000
Deaths
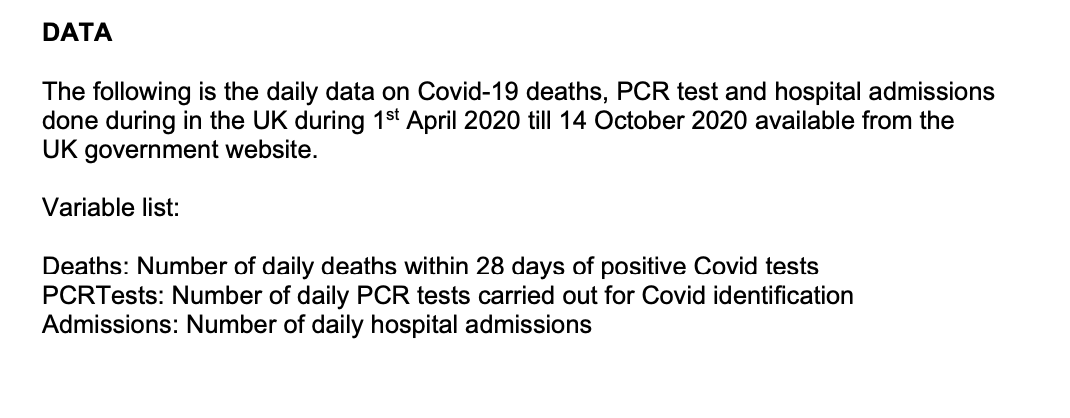
Transcribed Image Text:DATA
The following is the daily data on Covid-19 deaths, PCR test and hospital admissions
done during in the UK during 1st April 2020 till 14 October 2020 available from the
UK government website.
Variable list:
Deaths: Number of daily deaths within 28 days of positive Covid tests
PCRTests: Number of daily PCR tests carried out for Covid identification
Admissions: Number of daily hospital admissions
Expert Solution
This question has been solved!
Explore an expertly crafted, step-by-step solution for a thorough understanding of key concepts.

Step by step
Solved in 3 steps

Knowledge Booster


Learn more about
Need a deep-dive on the concept behind this application? Look no further. Learn more about this topic, statistics and related others by exploring similar questions and additional content below.Recommended textbooks for you
Big Ideas Math A Bridge To Success Algebra 1: Stu…
Algebra
ISBN:
9781680331141
Author:
HOUGHTON MIFFLIN HARCOURT
Publisher:
Houghton Mifflin Harcourt

Glencoe Algebra 1, Student Edition, 9780079039897…
Algebra
ISBN:
9780079039897
Author:
Carter
Publisher:
McGraw Hill

Holt Mcdougal Larson Pre-algebra: Student Edition…
Algebra
ISBN:
9780547587776
Author:
HOLT MCDOUGAL
Publisher:
HOLT MCDOUGAL
Big Ideas Math A Bridge To Success Algebra 1: Stu…
Algebra
ISBN:
9781680331141
Author:
HOUGHTON MIFFLIN HARCOURT
Publisher:
Houghton Mifflin Harcourt
Glencoe Algebra 1, Student Edition, 9780079039897…
Algebra
ISBN:
9780079039897
Author:
Carter
Publisher:
McGraw Hill
Holt Mcdougal Larson Pre-algebra: Student Edition…
Algebra
ISBN:
9780547587776
Author:
HOLT MCDOUGAL
Publisher:
HOLT MCDOUGAL

Functions and Change: A Modeling Approach to Coll…
Algebra
ISBN:
9781337111348
Author:
Bruce Crauder, Benny Evans, Alan Noell
Publisher:
Cengage Learning