Calculate the mean percent of African American persons living below the poverty level. This will be the third column

MATLAB: An Introduction with Applications
6th Edition
ISBN:9781119256830
Author:Amos Gilat
Publisher:Amos Gilat
Chapter1: Starting With Matlab
Section: Chapter Questions
Problem 1P
icon
Related questions
icon
Concept explainers
Topic Video
Question
Calculate the mean percent of African American persons living below the poverty level. This will be the third column
North Dakota
14
11.6
19.3
37.6
35.
Ohio
16.6
14.0
33.7
30.3
13.2
Oklahoma
19.4
16.9
34.7
24.8
17.8
Oregon
14.8
14.4
28.2
21.0
14.8
Pennsylvania
15.3
12.3
30.9
31.9
16.7
Rhode Island
13.6
10.9
26.2
43.5
10.5
South Carolina
South Dakota
18.6
13.1
11.6
31.1
17.2
12.3
15.7
21.9
52.8
18.3
Tennessee
18.1
16.0
27.0
31.2
12.3
Texas
18.3
17.1
24.2
20.3
12.6
Utah
11.8
10.5
36.2
34.1
16.3
Vermont
13.4
12.8
40.6
24.3
14.7
Virginis
Washington
West Virginia
13.0
10.5
21.2
13.7
9.7
12.8
11.6
23.1
26.6
9.8
21.0
20.5
34.8
21.0
15.9
Wisconsin
13.7
11.3
37.0
34.1
15.8
Wyoming
13.0
12.4
30.7
26.8
24.1
48 9
Puerto Rico
52.4
49 7
54.5
46.9
(99+
Transcribed Image Text:North Dakota 14 11.6 19.3 37.6 35. Ohio 16.6 14.0 33.7 30.3 13.2 Oklahoma 19.4 16.9 34.7 24.8 17.8 Oregon 14.8 14.4 28.2 21.0 14.8 Pennsylvania 15.3 12.3 30.9 31.9 16.7 Rhode Island 13.6 10.9 26.2 43.5 10.5 South Carolina South Dakota 18.6 13.1 11.6 31.1 17.2 12.3 15.7 21.9 52.8 18.3 Tennessee 18.1 16.0 27.0 31.2 12.3 Texas 18.3 17.1 24.2 20.3 12.6 Utah 11.8 10.5 36.2 34.1 16.3 Vermont 13.4 12.8 40.6 24.3 14.7 Virginis Washington West Virginia 13.0 10.5 21.2 13.7 9.7 12.8 11.6 23.1 26.6 9.8 21.0 20.5 34.8 21.0 15.9 Wisconsin 13.7 11.3 37.0 34.1 15.8 Wyoming 13.0 12.4 30.7 26.8 24.1 48 9 Puerto Rico 52.4 49 7 54.5 46.9 (99+
Total
Population
Black or
Africen
American
American Indian
and Alaska
Native
White
Asia
Alabama
20.4
16.0
30.8
21.2
14.
Alaska
13.9
9.8
20.4
30.0
9.5
Arizona
17.5
15.9
22.9
35.7
14.
Arkensas
21.3
18.3
34.6
25.0
13.
Califomia
15.8
14.6
23.2
22.1
11.
Colorado
12.1
11.2
24.6
26.2
10.
Connecticut
12.8
10.0
24.2
32.3
8.8
Delaware
14.0
11.1
21.2
24.6
12
District of
Columbis
16.5
54.7
14.
25.8
26.2
6.1
Florids
16.9
14.8
24.5
13.
Georgis
17.5
13.3
24.7
28.7
12
Hawsii
11.5
11.5
9.6
15.5
7.8
Idaho
15.6
14.9
16.8
31.6
20.
Illinois
14.9
11.7
30.0
20.9
12.
Indiana
15.9
13.8
30.7
21.6
20.
lowa
14.9
13.5
37.9
39.2
19.
Kansas
15.0
13.3
29.8
24.6
16.
Kentucky
20.8
19.8
30.8
23.2
17.
Louisigna
23.8
17.1
36.8
30.0
16
Maine
14.4
13.8
41.5
23.6
18.
Maryland
11.7
8.5
16.7
18.7
10.
Massachusetts
11.9
9.9
22.1
39.6
13.
Michigan
16.6
13.7
31.9
31.2
14
Minnesota
11.9
9.4
34.1
37.5
15.
16.7
38 2
34.8
22.
18
Mississippi
25.4
Missouri
16.8
15.1
27.9
33.0
Montana
16.7
14.9
14.8
42.3
12.
Nebraska
13.9
12.3
32.9
30.7
17
18.2
14.5
25.2
18.0
11
Nevada
New
9.7
17.1
16.3
7.
Hampshire
New Jersey
9.8
12.2
9.8
21.0
18.2
7.
New Mexico
23.4
21.0
26 3
36.4
14
New York
18.5
12.8
24.7
25.5
18
North Carolina
18.1
145
27 7
33.5
10
12 3
37.6
30.3
North Dakots
14
16
35
Ohio
16.6
40
35 7
13
Transcribed Image Text:Total Population Black or Africen American American Indian and Alaska Native White Asia Alabama 20.4 16.0 30.8 21.2 14. Alaska 13.9 9.8 20.4 30.0 9.5 Arizona 17.5 15.9 22.9 35.7 14. Arkensas 21.3 18.3 34.6 25.0 13. Califomia 15.8 14.6 23.2 22.1 11. Colorado 12.1 11.2 24.6 26.2 10. Connecticut 12.8 10.0 24.2 32.3 8.8 Delaware 14.0 11.1 21.2 24.6 12 District of Columbis 16.5 54.7 14. 25.8 26.2 6.1 Florids 16.9 14.8 24.5 13. Georgis 17.5 13.3 24.7 28.7 12 Hawsii 11.5 11.5 9.6 15.5 7.8 Idaho 15.6 14.9 16.8 31.6 20. Illinois 14.9 11.7 30.0 20.9 12. Indiana 15.9 13.8 30.7 21.6 20. lowa 14.9 13.5 37.9 39.2 19. Kansas 15.0 13.3 29.8 24.6 16. Kentucky 20.8 19.8 30.8 23.2 17. Louisigna 23.8 17.1 36.8 30.0 16 Maine 14.4 13.8 41.5 23.6 18. Maryland 11.7 8.5 16.7 18.7 10. Massachusetts 11.9 9.9 22.1 39.6 13. Michigan 16.6 13.7 31.9 31.2 14 Minnesota 11.9 9.4 34.1 37.5 15. 16.7 38 2 34.8 22. 18 Mississippi 25.4 Missouri 16.8 15.1 27.9 33.0 Montana 16.7 14.9 14.8 42.3 12. Nebraska 13.9 12.3 32.9 30.7 17 18.2 14.5 25.2 18.0 11 Nevada New 9.7 17.1 16.3 7. Hampshire New Jersey 9.8 12.2 9.8 21.0 18.2 7. New Mexico 23.4 21.0 26 3 36.4 14 New York 18.5 12.8 24.7 25.5 18 North Carolina 18.1 145 27 7 33.5 10 12 3 37.6 30.3 North Dakots 14 16 35 Ohio 16.6 40 35 7 13
Expert Solution
Step 1

Solution:

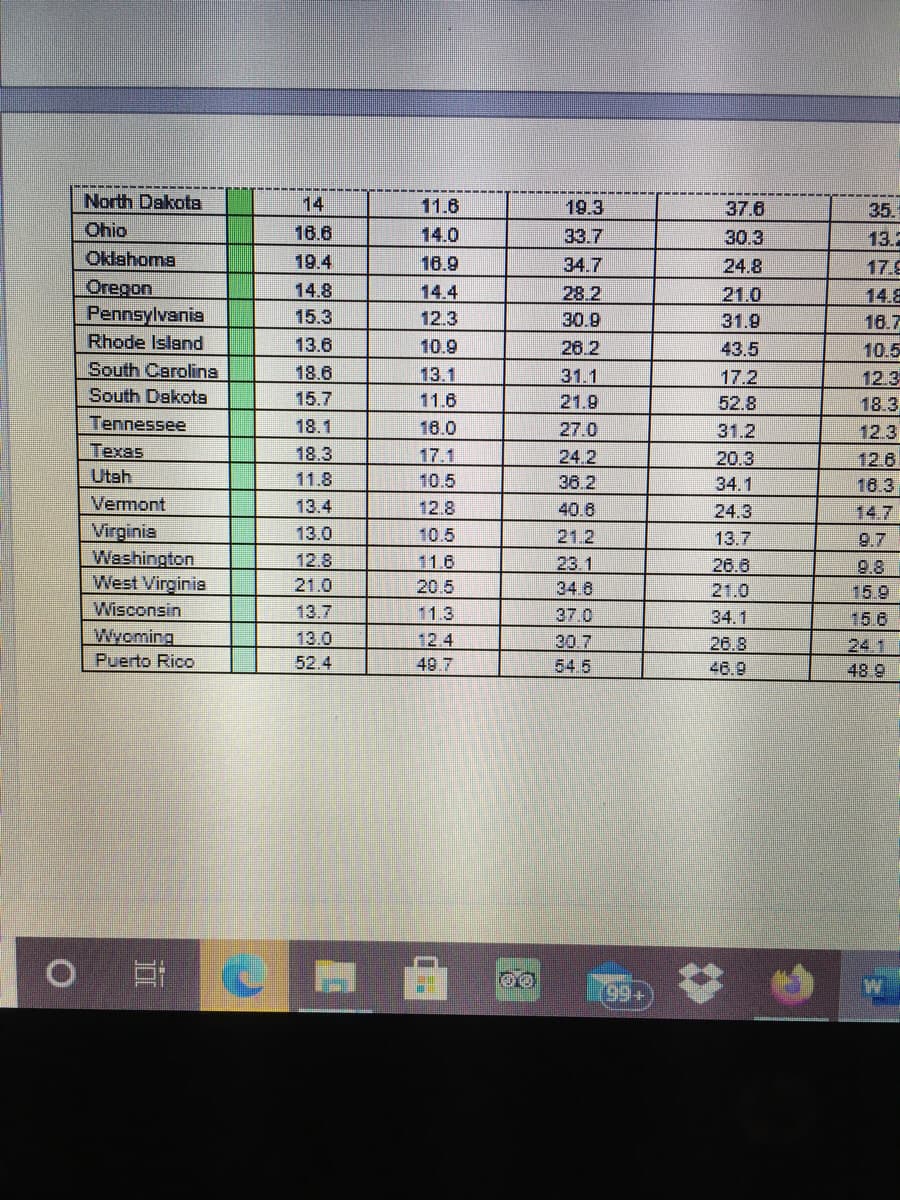
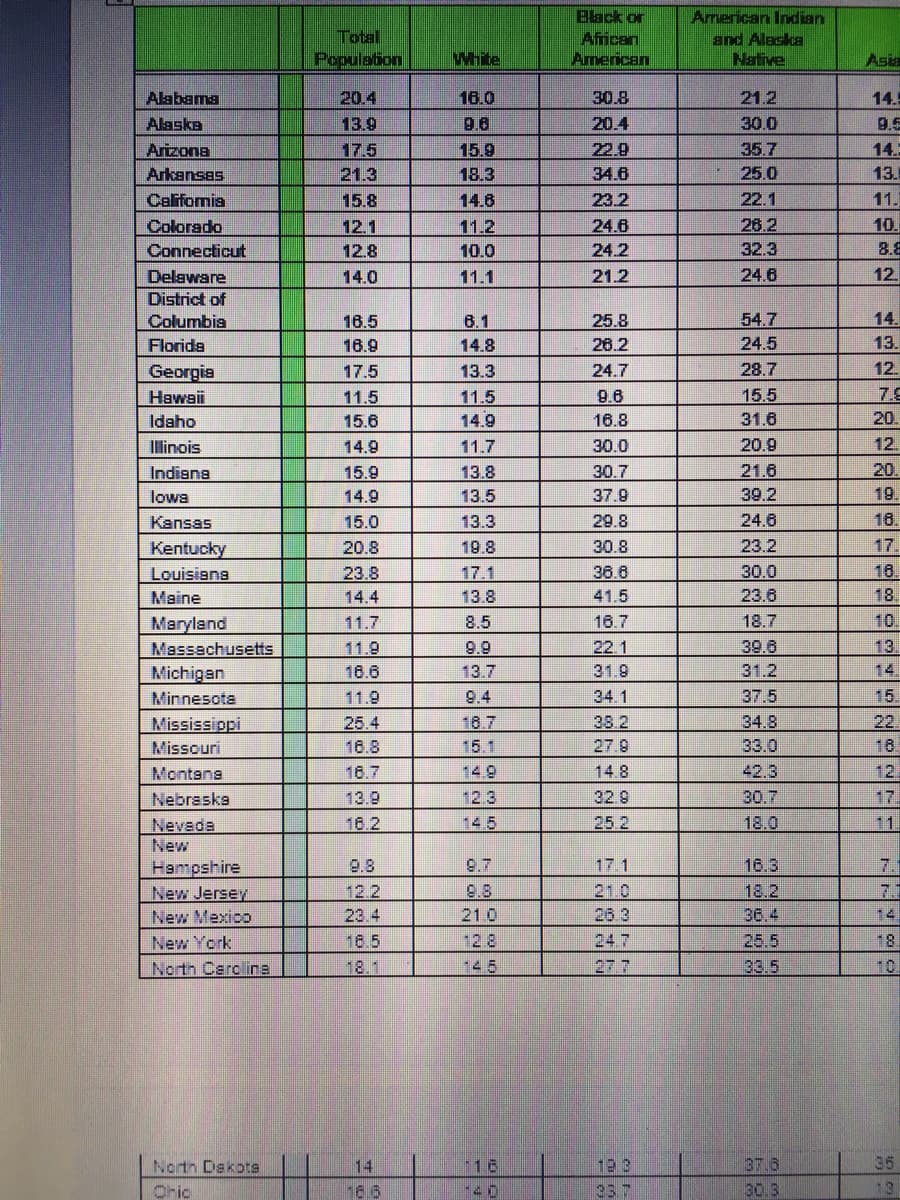
The mean percent of African American persons living below the poverty level is required.

It can be easily calculated using MS-Excel. For that, enter the given data from the column "Black or African American" in any column of an excel sheet. Let the data be entered from A1 to A52 (that is, in column A, from row 1 to row 52). 


steps

Step by step

Solved in 2 steps

Blurred answer
Knowledge Booster
Centre, Spread, and Shape of a Distribution
Learn more about
Need a deep-dive on the concept behind this application? Look no further. Learn more about this topic, statistics and related others by exploring similar questions and additional content below.
Similar questions
  • SEE MORE QUESTIONS
Recommended textbooks for you
MATLAB: An Introduction with Applications
Statistics
ISBN:
9781119256830
Author:
Amos Gilat
Publisher:
John Wiley & Sons Inc
Probability and Statistics for Engineering and th…
Statistics
ISBN:
9781305251809
Author:
Jay L. Devore
Publisher:
Cengage Learning
Statistics for The Behavioral Sciences (MindTap C…
Statistics
ISBN:
9781305504912
Author:
Frederick J Gravetter, Larry B. Wallnau
Publisher:
Cengage Learning
Elementary Statistics: Picturing the World (7th E…
Statistics
ISBN:
9780134683416
Author:
Ron Larson, Betsy Farber
Publisher:
PEARSON
The Basic Practice of Statistics
Statistics
ISBN:
9781319042578
Author:
David S. Moore, William I. Notz, Michael A. Fligner
Publisher:
W. H. Freeman
Introduction to the Practice of Statistics
Statistics
ISBN:
9781319013387
Author:
David S. Moore, George P. McCabe, Bruce A. Craig
Publisher:
W. H. Freeman