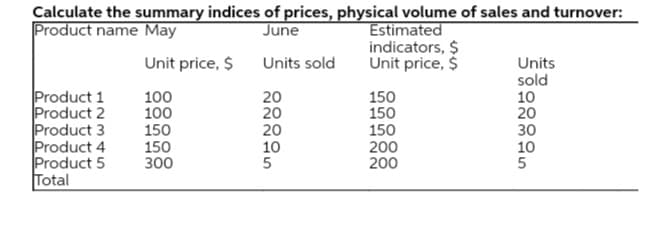
Calculate the summary indices of prices, physical volume of sales and turnover: Product name May Estimated indicators, $ Unit price, $ June Unit price, $ Units sold Product 1 Product 2 Product 3 Product 4 Product 5 Total Units sold 10 20 30 10 5 100 100 150 150 300 20 20 20 10 150 150 150 200 200


Q: YEAR PRODUCT 1988 1989 1990 1991 $6.00 $8.00 price: $2.00 quantity: price: $1.00 product $4.00 2,000…
A: Price level in 1990 (using 1988 consumption basket) = 2000 × $6 + 1000 × $1 + 1000 × $2 = $15,000…
Q: 18. The following are the index numbers of wholesale prices of a commodity based on 2011: Year Index…
A: An index number shows changes in a variable over the period of a time as prices can be taken as…
Q: Below is a table containing data on product demand for the most recent three months along with the…
A: MSE stands for mean squared error which is used to estimate how close a regression line to a set of…
Q: The table below is extracted from Goodland Republic Bureau of Statistics records for 2016 -2017. Use…
A: Nominal GDP can be calculated as follows:
Q: Next week will be a very important week for FAP company. The company decided to go live online, to…
A: All of the options provide with the aim of development.
Q: If in Zimbabwe, total sales value is $6000 million and change in stock is $450 million Find the…
A: Value of Output = Value of total sales + Value of change in stock
Q: QUESTION 20 YEAR PRODUCT 1988 1989 1990 1991 price: $2.00 quantity: price: $1.00 1,000 $6.00 $8.00…
A: Consumer Price Index or CPI measures the total cost of goods and services that are being purchased…
Q: What type of data is this, is it (nominal, ordinal, interval or ratio) and summarize it in ways…
A: It is ratioo data.
Q: Monthly Consumer Price Index from January 2015 to December 2020 (Source: STATIN) Month…
A: Real wage is the wage that is found by taking into consideration the current inflation rate. It is…
Q: Australia has one of the highest per capita GHG emissions in the world. Show how Australia compares…
A: 1. Australia has the highest rate of GHG emissions per capita which is around 15.5, for around 10n…
Q: Question: Given the following: y = e?e3 This can also be written as: y = e
A: Law of exponents: If the base is the same, then add the powers in case of multiplication of numbers…
Q: A certain beverage company provides a complete line of beer, wine, and soft drink products for…
A: Price relative is the ratio between the price of a product in one period and its price in another…
Q: US T-bills (Rf asset) CPI Year Large Stocks LT Gov Bonds (inflation) 2016 12.95% 2.35% 0.20% 1.90%…
A: Answer given below,
Q: POn the basis of quarterly sales (in $ lakhs) of a certain commodity for the years 2001-2005 the…
A:
Q: The following are extracts from the national income account of a country. COMPOSITION Compensation…
A: 1.
Q: 26The country of Caspir produces only cereal and milk. Quantities and prices of these goods for the…
A: Nominal GDP = Current year quantity * Current year price Real GDP = Current year quantity * Base…
Q: Write a profit function and graph it to advise the grower on the most profitable amount of…
A: Profit refers to the difference between the total revenue and total costs which a producer earns for…
Q: Prepare a composite (weighted) index for housing construction costs in 2008, using the following…
A: Weighted index is fraction of that years cost compare to total cost of all the year. In this table…
Q: Activity 2: Taxes and Salary are related to one another when it come to purchasing power which…
A: The worth of a currency is stated in terms of the number of commodities or services that one unit of…
Q: Refer to the following table. Second Event PL Total 41 S Click here for the Excel Data Fie a.…
A: The table lists the number of times the first event A and the second event B happens. The total…
Q: From the data calculate the NDP at FC. Wages and salaries are 700 dollars, rent 100 dollars,…
A: Given values: Wages and salaries = $700 Rent = 100 Depreciation = $50 Subsidies = $100
Q: 1- Kingdom Enterprises is a Indian exporter of agriculture products and files all of its financial…
A: A company’s total net sales refer to the sum of its gross sales subtracted by returns, discounts,…
Q: anth Sales Forecast 1 Forecast 2 1 770 771 769 2 789 785 787 3 794 790 792 780 784 798 768 770 774…
A: *Answer: Given data Month Sales Forecast1 Forecast 2 1 770 771 769 2 789 785 787 3…
Q: Find out the annual and overall change in price ($/litre) of gas oil, diesel oil, and naphtha and…
A: In this world the usable energy is of two types:- Renewable energy sources and non -renewable energy…
Q: Suppose the relationship between the government's tax revenue (T) and national income (Y) is…
A: Given T=30+0.5Y so here slope is 0.5 we can draw the graph of the equation which are as follow-
Q: Calculate Happy Land Republic’s nominal GDP and real GDP in 2016 ii. Why does real GDP always defer…
A: Gross domestic product (GDP) is the monetary value of all final goods and services produced within…
Q: You are employed by the state bureau of economic development. There is a demand for a leading…
A: An economic indicator refers to a statistic about an economic activity. Economic indicators allow an…
Q: The equation D(x) = 208(1.257)* represents the annual number of debit card transactions in Canada,…
A: We have given D(x)=2081.257x .... (1) Where D is in million and x is in years since…
Q: b. Construct price index number using Laspeyre's Method Year 2014 Price 20 Year 2015 Price Commodity…
A: Laspeyer's formula to calculate the Price index P01 = sum of (Price of current period × base year…
Q: 6. Expenditures and Income Approaches Consumption Expenditures Wages Taxes on Production and Imports…
A: The measure that depicts the final value of goods and services being produced in an economy during a…
Q: According to data given in the table, to use index system to analyze the effect price and sales…
A: We are going to analyse the effect of various types of indexes on sales value.
Q: Commodity Quantity (units) Value- 1995 2000 1995 2000 -6. (a) Compute price inclex and quantity…
A: SOLUTION
Q: 1- Indicate if the following data sets represent time-series, cross section or panel data . a-…
A: 1. Time series data is a sequence of data points indexed in time order. For example the population…
Q: Question 3 We run the following model: cigarette,+Bymale, + we find that the R2 is 0.12 and the SSR…
A: Question 1: cigarette=B0+B1price+e B0: When the price of the cigarette is zero, the number of…
Q: Price Change Category Weight 2008-2009 Product Food 15 4% 60 Housing 3% Apparel 15 -1.5% -22.5 Trans…
A: The percentage change in a price index is used to calculate the inflation rate (such as CPI or the…
Q: What is the Consumer Price Index (CPI)? What is the difference between commodity-specific and…
A: Price index is a measure of how prices tend to change over a period of time and also measure…
Q: Question 22 A computer depreciates 32% per year. A computer is bought for $1200. What is an equation…
A: As per honor code, we’ll answer only one question at a time , we have answered the first question…
Q: 32. The seasonal indices of the sales of garments of a particular type in a certain shop are given…
A: Answer is given in the attached image:
Q: 26The country of Caspir produces only cereal and milk. Quantities and prices of these goods for the…
A: Nominal GDP measures the market value of final goods and services at current year prices. Real GDP…
Q: 0.997738 Coefficient Intercept Interest Rate -1.61538 14.88462 1. Are there factors other than…
A: Regression analysis is a powerful statistical method that allows you to examine the relationship…
Q: X.The table below is extracted from Goodland Republic Bureau of Statistics records for 2016 -2017.…
A: As per the final goods and services that have been produced within the economy during a financial…
Q: Question 5. A quantitative research project is recording the hourly concentration of CO (carbon…
A: We will use definitions such as Nominal data; Ordinal Data; Interval Data and Ratio Data to answer…
Q: The table below is extracted from Happy land Republic, Bureau of Statistics records for 2018-2019.…
A: GDP: It is the value of all goods and services produced within a country during a particular time in…
Q: Given that the consumer price index was 82.4 in 1980 and 215.3 in 2008, find the price in 2008…
A: The measure that depicts changes in prices of consumers based on the basket of services and goods is…
Q: ) In 2021, Jay purchases a car for $22,000. The value of the car depreciates (exponentially…
A: The above question is based on the calculation of Depreciation. Depreciation refers to the fall in…
Q: The price of wheat (per kg) is given for the vears 1964 to 1973. Calculate simple index numbers…
A: A simple index number of price is used to find the variation of the price between the current period…
6

Step by step
Solved in 2 steps

- The table below is extracted from Goodland Republic Bureau of Statistics records for 2016 -2017. Use the information to answer the questions that follow. Goodland Economy 2017 and 2018 Item Price 2017 Price 2018 Production Price per unit Production Price per unit Rice (000tons) 50000 1.5 55000 2 Wheat (000 tons) 100000 2 98000 2.5 Tractor mid size( units ) 50000 23000 45000 24500 Cotton (000 tons) 120000 100 110000 120 Used Cars (00) 5000 5000 6000 7000 Manufacture Garments (000 tons) 150000 50 145000 70 Eggs (000 trays) 2000 2.5 2300 3.5 Coca cola (000litres) 6000 0.8 6500 1.2 Pepsi cola (000 litres) 700 1.1 850 1.5 Beef (000 tons) 5000 6.5 4800 8.5 Second hand clothes (000 tons) 500 15 450 25 Alcoholic Beverages (000 litres) 500 3.25 600 3.75 Milk (000) 7000 2.3 7500 2.5 Examine the status of the economic welfare in Goodland Republic in 2018 based on your GDP deflator, nominal GDP and Real GDP. Also, explain the reasons why it is necessary to…The Wall Street Journal’s website, www.wsj.com, reported the number of cars and light-duty trucks sold through October of 2014 and October of 2015. The top sixteen manufacturers are listed here. The sales information for all manufacturers can be accessed in a data file below. Sales data are often reported in this way to compare current sales to last year’s sales. Year-to-Date Sales Manufacturer Through October 2015 Through October 2014 General Motors Corp. 2,562,840 2,434,707 Ford Motor Company 2,178,587 2,065,612 Toyota Motor Sales USA Inc. 2,071,446 1,975,368 Chrysler 1,814,268 1,687,313 American Honda Motor Co Inc. 1,320,217 1,281,777 Nissan North America Inc. 1,238,535 1,166,389 Hyundai Motor America 638,195 607,539 Kia Motors America Inc. 526,024 489,711 Subaru of America Inc. 480,331 418,497 Volkswagen of America Inc. 294,602 301,187 Mercedes-Benz 301,915 281,728 BMW of North America Inc.…A certain beverage company provides a complete line of beer, wine, and soft drink products for distribution through retail outlets in central Iowa. Unit price data for 2011 and 2014 and quantities sold in cases for 2011 follow. Use 2011 as the base period. Unit Price ($) Item 2011 Quantity(cases) 2011 2014 Beer 35,000 17.50 20.15 Wine 5,000 100.00 117.00 Soft drink 70,000 8.00 8.80 Compute the price relatives for this company's products. (Round your answers to two decimal places.) Item Price Relative Beer Wine 117.00 Soft drink 110.00 Use a weighted average of price relatives to show that this method provides the same index as the weighted aggregate method. (Round your answers to the nearest integer.) weighted average of price relatives index: ____ weighted aggregate price index :______
- The table below is extracted from Goodland Republic Bureau of Statistics records for 2016 -2017. Use the information to answer the questions that follow. Item Price 2017 (Base Year) Price 2018 Production Price per Unit ($) Production Price per Unit ($) Rice (tons) 50,000 1.50 55,000 2.00 Wheat (tons) 100,000 2.00 98,000 2.50 Tractors mid-size (units) 50,000 23000.00 45,000 2,450.00 Cotton (tons) 120,000 100.00 110,000 120.00 Used cars 5,000 5,000.00 6,000 7,000.00 Manufacture garments (tons) 150,000 50.00 145,000 70.00 Eggs (trays) 2,000 2.50 2,300 3.50 Coca Cola (litres) 6,000 0.80 6,500 1.20 Pepsi Cola (litres) 700 1.10 850 1.50 Beef (tons) 5,000 6.50 4,800 8.50 Second Hand Clothes (tons) 500 15.00 450 25.00 Alcoholic Beverages (litres) 500 3.25 600 3.75 Milk (litres) 7,000 2.30 7,500 2.50 Examine the…Diagram is must!NOTE: pls explain what’s on the image attached
- JskxokdUsing the specific identification method: Date Units purchased Cost per unit Ending inventory June 1 12 Echo Show’s 360 $ 272 2 Echo Show’s from June July 1 52 Echo Show’s 360 247 11 Echo Show’s from July August 1 65 Echo Show’s 360 237 8 Echo Show’s from August a. Calculate the ending inventory ____________ ? b. Calculate the cost of goods sold _____________ ?Please answer both sir please i will rate otherwise Dounvote I have no more question