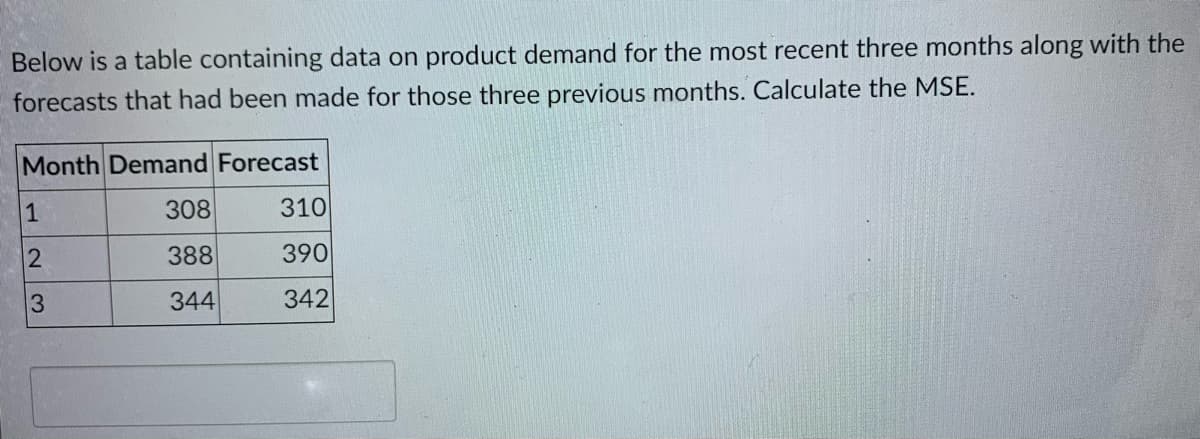
Below is a table containing data on product demand for the most recent three months along with the Forecasts that had been made for those three previous months. Calculate the MSE. Month Demand Forecast 1 308 310 388 390 344 342


Q: Slope, b1 = MSE= c. What is the forecast for t = 8? If required, round your answer to three decimal…
A: *Answer: *b Here, the sample size is n = 7. Now, obtain the following table for necessary…
Q: Use the following data to calculate the information below
A: We know Elasticity of demand can be calculated as : 1. Percentage Method = -∆Q∆P* PQ…
Q: 18. The following are the index numbers of wholesale prices of a commodity based on 2011: Year Index…
A: An index number shows changes in a variable over the period of a time as prices can be taken as…
Q: 1. DIHL CO.sa Danao-based logistcs company owned by Engr. Donaid H. Lalican. Antcipating the growing…
A: Find the Given details below:
Q: Consider the following demand data. Penod 2. 3. 4. 6. 6. 10 demand 130 452 428 470 478 Use Holt's…
A: The forecast can be calculated by the below formula: Ft+1= Dt+Dt-1+Dt-2/3 F = Forecast D = Demand F…
Q: A manager uses a trend equation plus quarterly relatives to predict demand. Quarter relatives are…
A: MAD=MEAN ABSOLUTE DEVIATION mean absolute deviation of a dataset is the average distance between…
Q: Two different forecasting techniques (F1 and F2) were used to forecast demand for cases of bottled…
A:
Q: Monthly Consumer Price Index from January 2015 to December 2020 (Source: STATIN) Month…
A: Real wage is the wage that is found by taking into consideration the current inflation rate. It is…
Q: The table below is extracted from Goodland Republic Bureau of Statistics records for 2016 -2017. Use…
A: Nominal GDP : GDP calculated in prices of the current year. Real GDP : GDP calculated in prices of…
Q: X 13.1.69 Question Help The year 2018 price of a new car is given below. Find the estimated future…
A: Given price of car = $35900 Inflation rate of 2024 = 2% Inflation rate of 2030 = 2% Inflation rate…
Q: Question: Given the following: y = e?e3 This can also be written as: y = e
A: Law of exponents: If the base is the same, then add the powers in case of multiplication of numbers…
Q: Task II: Your manager asked you to answer the following: A) Define quantitative and qualitative…
A: Since you have asked a multi-part question, and according to the policy, we can only solve the first…
Q: Calculate the market basket prices for each period. See attached.
A: The term market basket refers to a bundle or group of products that can be indicators of the overall…
Q: Techs Ltd is an electronics manufacturer and retailer. Its main products are Netbook computers, PCs…
A: Economics is a branch of social science that describes and analyzes the behaviors and decisions…
Q: The economy of country Y produces 5 commodities; rice, salted fish, sugar, salt, and oil. The…
A: Laspeyres consumer price index = ∑(Observation year prices * base year quantity) / ∑ (base year…
Q: data: "Analyzing the impact The following example indicates a/an . of minimum wage changes on…
A: the correct answer is A. panel data
Q: Consider the following actual and forecast demandlevels for Big Mac hamburgers at a local McDonald’s…
A: The following formula will calculate the forecast for the big mac demand for Friday.
Q: You have been asked to prepare a forecast for your company's product, bottled water. Discuss the…
A: Forecasting is a technique for predicting the future based on data and trend analysis. Companies…
Q: d) Paasche price index e) Fisher Price Index f) Relative weighted average of prices
A: Index number is the measure of changes in a variable over the period of time. It measures the…
Q: Based on the information in the following table, use the Weighted moving average Approach to…
A: Given : Month weight demand Sep 1 161 Oct 2 122 Nov 3 106
Q: At Price of $425 per XBOX unit, we would see: a excess supply b excess demand c consumer surplus d…
A: Demand refers to the desires backed by ability and willingness of the consumer to pay for the…
Q: an index decreases from 110 to 105. the percentage change in the index is?
A: % Change=x2-x1x1x100 =105-110110x100 =-0.045x100 =-4.5%…
Q: The following information is for Questions 30-33: A firm's demand data from the last two quarters is…
A: Since you have posted a question with multiple sub-parts, we will solve the first three sub-parts…
Q: Look up the current price of oil in a commodity index. (Ex. stock market). What trends do you see…
A: Crude oil is the source of various fuels. Gas stations are stations like petrol pumps where natural…
Q: ast year, a toy manufacturer introduced a new toy truck that was a huge success. The company…
A: A break-even price is the amount of money, or change in value, for which an asset must be sold to…
Q: Question 4 Consider the following data: Month Bicycles Sold 21.6 2. 22.9 25.5 21.9 23.9 6. 27.5 7…
A: We are going to calculate Mean Absolute Percentage Error using its formula and definition.
Q: Find out the annual and overall change in price ($/litre) of gas oil, diesel oil, and naphtha and…
A: In this world the usable energy is of two types:- Renewable energy sources and non -renewable energy…
Q: Calculate Happy Land Republic’s nominal GDP and real GDP in 2016 ii. Why does real GDP always defer…
A: Gross domestic product (GDP) is the monetary value of all final goods and services produced within…
Q: (15) As a result of an earthquake the __________________________ __________________________…
A: The earthquake would cause the fall in the production capacity.
Q: The forecast with out seasonality is modeled as: Sales 6 t+ 236.00, where t= time in months,…
A: Seasonality refers to a pattern which is repetitive in a time series data. It repeats over a period…
Q: The small country of Macroland has a population of 100,000 people over the age of 18 and under 65.…
A: The labor force includes all those in an economy that are willing and able to work.
Q: Good Quantity 2017 prices 2018 prices 2019 prices A 10 1.750 KD 2.000 KD 1.750 KD B 20 2.000 KD…
A: Given: Quantity of A=10 Quantity of B=20 Quantity of Z=10 Note: Due to multiple subparts being…
Q: Consider the CEO of a company that sells coffee at small free standing shops around the country. The…
A:
Q: Using equations (1) and (2), sketch the demand and supply diagram
A: "Since you have not posted the parts of the question, we are only drawing the demand and supply…
Q: The Pear company sells a smart phone for $250. Its sales have averaged 8,000 units per month over…
A: given The Pear company sells a smart phone for $250. Its sales have averaged 8,000 units per month…
Q: uantity supplied. Slope upwards. Slope downwards.
A: The supply bend is a realistic portrayal of the connection between's the cost of a decent or…
Q: 40. The following are the prices of commodities in 2016 and 2017. Calculate a price index based on…
A: In the question above, it is given the prices of commodities in year 2016 and 2017. We have…
Q: Tom Glass forecasts electrical demand for the Flatlands Public Power District (FPPD). The FPPD wants…
A: As the table provided in the question, the weekly demand points it can be monitored that the demand…
Q: What action should be taken when unacceptable error is found in tracking a forecast?
A: Forecasting is the method of predicting future trends in the economy by analyzing the present and…
Q: 0.997738 Coefficient Intercept Interest Rate -1.61538 14.88462 1. Are there factors other than…
A: Regression analysis is a powerful statistical method that allows you to examine the relationship…
Q: The table below is extracted from Happy land Republic, Bureau of Statistics records for 2018-2019.…
A: GDP: It is the value of all goods and services produced within a country during a particular time in…
Q: Forecast the demand for the rice for a country for the year 2019 on the basis of 7-year data given…
A: Demand refers to consumer's willingness to purchase the goods and services at the given price. It is…

Step by step
Solved in 3 steps

- Using equations (1) and (2), sketch the demand and supply diagram and indicate your results from parts (a) – (d). Correctly label thediagram.FORCASTING Month Time QJan 1 46Feb 2 56Mar 3 72Apr 4 67May 5 77Jun 6 66Jul 7 69Aug 8 79Sep 9 88Oct 10 91Nov 11 94Dec 12 104Jan ?Feb ? Make a forecast of the demand for the month of January and FebruaryThis is the correct chart. Can you redo the answer wth this information?
- Lauren’s Beauty Boutique has experienced the followingweekly sales: Week Sales1 4322 3963 4154 4585 460 Forecast sales for week 6 using the naïve method, a simpleaverage, and a three-period moving averageMr. Geppetto uses exponential smoothing to predict revenue in his wood carving business. He uses a weight of = .4 for the naïve forecast and (1-) = .6 for the past forecast. What revenue did he predict for March using the data below? MONTH REVENUE FORECAST Nov 100 100 Dec 90 100 Jan 115 ---- Feb 110 ---- MARCH ? ?Use the charts to find aw of each.
- Task II:Your manager asked you to answer the following:A) Define quantitative and qualitative data.B) Mention the differences between quantitative and qualitative data.C) Provide Real-World one example with Quantitative Data that could be presentedas a histogram (The example should contain the data collected + draw the frequency table for bothexamples).D) Provide Real-World one example with Qualitative Data that could be presented as a bar graph.(The example should contain the data collected + draw the frequency table for bothexamples). E) Use Excel software to represent the data in parts C and D.FORCASTING using the data below can you answer the question: Month SalesJan-16 747Feb-16 697Mar-16 1014Apr-16 1126May-16 1105Jun-16 1450Jul-16 1639Aug-16 1711Sep-16 1307Oct-16 1223Nov-16 975Dec-16 953Jan-17 1024Feb-17 928Mar-17 1442Apr-17 1371May-17 1536Jun-17 2004Jul-17 1854Aug-17 1951Sep-17 1516Oct-17 1642Nov-17 1166Dec-17 1106Jan-18 1189Feb-18 1209Mar-18 1754Apr-18 1843May-18 1769Jun-18 2207Jul-18 2471Aug-18 2288Sep-18 1867Oct-18 1980Nov-18 1418Dec-18 1333Jan-19 1333Feb-19 1370Mar-19 2142Apr-19 2138May-19 2078Jun-19 2960Jul-19 2616Aug-19 2861Sep-19 2237Oct-19 2225Nov-19 1590Dec-19 1659Jan-20 1613Feb-20 1605Mar-20 2349Apr-20 2468May-20 2532Jun-20 3127Jul-20 3288Aug-20 3285Sep-20 2485Oct-20 2723Nov-20 1835Dec-20 1894 Consider five years of monthly profit for a company C) Discuss whether a simple exponential smoothing model works well with this data or not.calculate the missing values and show the calculation
- Alejandro is selling HDMI cables on eBay, and is trying to determine the best price to sell at. For the last 10 weeks, he has adjusted his price slightly each week and tracked the number of cables he sold. He plotted the results, and drew a line he feels fits the data well. Price ($) 3, 3.25, 3.5, 3.75, 4, 4.25, 4.5, 4.75, 5 Quantity Sold - 50, 100, 150, 200, 250 a) The line of best fit passes through the points (3.50, 230) and (4.75, 210). Find an equation for the line. Use variables: p for price in dollars, and Q for quantity of cables sold. b) Using this model, predict the number of cables Alejandro would sell at a price of $3.65, to the nearest whole cable. cablesCalculate the value of Total revenue if price per kg of apples are $15 and the total quantity of apples sold is 20 kga. Estimate the demand equation for the product. Month Price Amount January 18 50 February 16 55 March 14 60 April 12 65 May 10 70 June 8 75 b. Estimate the supply equation that the product presents. Month Price Amount January 10 70 February 11 90 March 12 110 April 13 130 May 14 150 June 15 170 c. If that buyer and seller of the above data come together in a market, will it be possible for the breakeven point to be obtained? Use the graphical and mathematical process to find the solution

