Calculate the X-bar control chart limits for a process with average X-bar equal to 700, and R-bar equal to 11, when using a sample size of n = 5. The specifications are 705 ± 15 and the process output is normally distributed, LCL = 695.39, UCL = 704.61 O LCL = 696.61, UCL = 703.39 LCL = 693.65, UCL = 706.35
Calculate the X-bar control chart limits for a process with average X-bar equal to 700, and R-bar equal to 11, when using a sample size of n = 5. The specifications are 705 ± 15 and the process output is normally distributed, LCL = 695.39, UCL = 704.61 O LCL = 696.61, UCL = 703.39 LCL = 693.65, UCL = 706.35

MATLAB: An Introduction with Applications
6th Edition
ISBN:9781119256830
Author:Amos Gilat
Publisher:Amos Gilat
Chapter1: Starting With Matlab
Section: Chapter Questions
Problem 1P

Related questions
Topic Video
Question
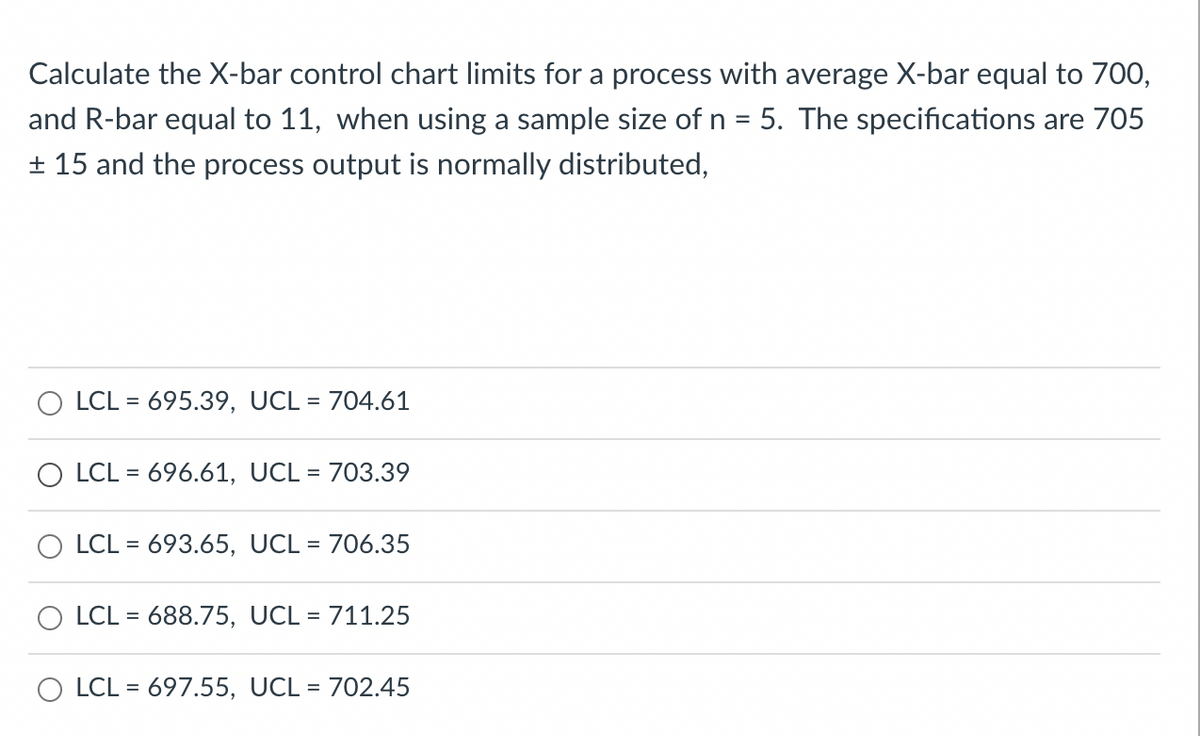
Transcribed Image Text:Calculate the X-bar control chart limits for a process with average X-bar equal to 700,
and R-bar equal to 11, when using a sample size of n = 5. The specifications are 705
+ 15 and the process output is normally distributed,
O LCL = 695.39, UCL = 704.61
%3D
O LCL = 696.61, UCL = 703.39
%3D
LCL = 693.65, UCL = 706.35
%D
LCL = 688.75, UCL = 711.25
O LCL = 697.55, UCL = 702.45
%D
Expert Solution
Step 1
X- bar chart: It is a graphic device which depicts the measurements revealing the state of their scatteredness from standard values and to keep control on the measurable characteristics of articles.
Given,

Trending now
This is a popular solution!

Step by step
Solved in 2 steps

Knowledge Booster


Learn more about
Need a deep-dive on the concept behind this application? Look no further. Learn more about this topic, statistics and related others by exploring similar questions and additional content below.Recommended textbooks for you
MATLAB: An Introduction with Applications
Statistics
ISBN:
9781119256830
Author:
Amos Gilat
Publisher:
John Wiley & Sons Inc

Probability and Statistics for Engineering and th…
Statistics
ISBN:
9781305251809
Author:
Jay L. Devore
Publisher:
Cengage Learning

Statistics for The Behavioral Sciences (MindTap C…
Statistics
ISBN:
9781305504912
Author:
Frederick J Gravetter, Larry B. Wallnau
Publisher:
Cengage Learning
MATLAB: An Introduction with Applications
Statistics
ISBN:
9781119256830
Author:
Amos Gilat
Publisher:
John Wiley & Sons Inc
Probability and Statistics for Engineering and th…
Statistics
ISBN:
9781305251809
Author:
Jay L. Devore
Publisher:
Cengage Learning
Statistics for The Behavioral Sciences (MindTap C…
Statistics
ISBN:
9781305504912
Author:
Frederick J Gravetter, Larry B. Wallnau
Publisher:
Cengage Learning

Elementary Statistics: Picturing the World (7th E…
Statistics
ISBN:
9780134683416
Author:
Ron Larson, Betsy Farber
Publisher:
PEARSON

The Basic Practice of Statistics
Statistics
ISBN:
9781319042578
Author:
David S. Moore, William I. Notz, Michael A. Fligner
Publisher:
W. H. Freeman

Introduction to the Practice of Statistics
Statistics
ISBN:
9781319013387
Author:
David S. Moore, George P. McCabe, Bruce A. Craig
Publisher:
W. H. Freeman