4. Of a group of 200 college men the number N who are taller than x inches is given below: 71 72 (6 ft) 71 43 X: 65 66 67 68 69 70 73 74 75 76 N: 197 195 184 167 137 101 25 11 (a) Construct a scatter plot for this data and explain why a logistic model is appropriate for this data. 207 If you did logistic regression you would see N(x)= 0.686x 1+(1.285 ×10²')e° (b) How is the shape of this curve different from that in number 3(a)? (c) How many men in the group are over 69.5 inches tall? (d) The tallest 85 men are all grouped together, all of these men are at least tall. Round to the nearest tenth of an inch. inches
4. Of a group of 200 college men the number N who are taller than x inches is given below: 71 72 (6 ft) 71 43 X: 65 66 67 68 69 70 73 74 75 76 N: 197 195 184 167 137 101 25 11 (a) Construct a scatter plot for this data and explain why a logistic model is appropriate for this data. 207 If you did logistic regression you would see N(x)= 0.686x 1+(1.285 ×10²')e° (b) How is the shape of this curve different from that in number 3(a)? (c) How many men in the group are over 69.5 inches tall? (d) The tallest 85 men are all grouped together, all of these men are at least tall. Round to the nearest tenth of an inch. inches

Chapter6: Exponential And Logarithmic Functions
Section6.8: Fitting Exponential Models To Data
Problem 1TI: Table 2 shows a recent graduate’s credit card balance each month after graduation. a. Use...

Related questions
Question
I need help being walked through the logistic growth problem that is in the image attached please :)
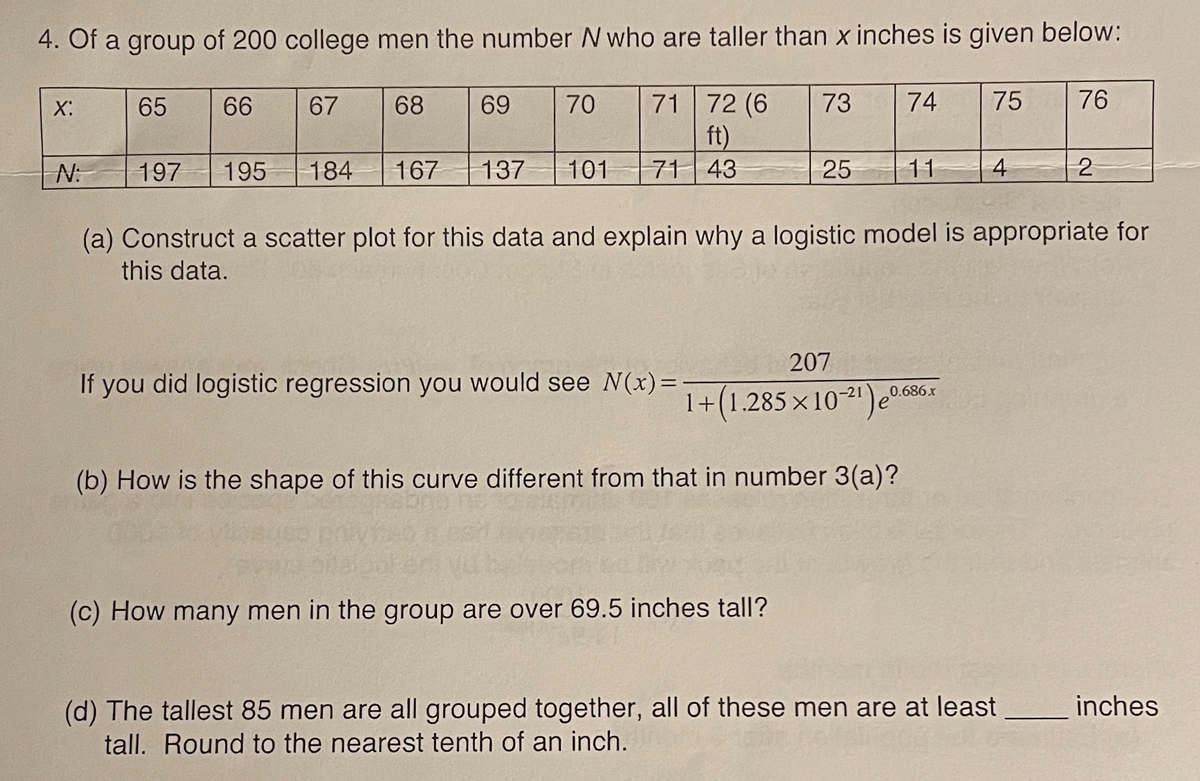
Transcribed Image Text:4. Of a group of 200 college men the number N who are taller than x inches is given below:
71 72 (6
ft)
71 43
X:
65
66
67
68
69
70
73
74
75
76
N:
197
195
184
167 137
101
25
11
(a) Construct a scatter plot for this data and explain why a logistic model is appropriate for
this data.
207
If you did logistic regression you would see N(x)=
0.686x
1+(1.285 ×10²')e°
(b) How is the shape of this curve different from that in number 3(a)?
(c) How many men in the group are over 69.5 inches tall?
(d) The tallest 85 men are all grouped together, all of these men are at least
tall. Round to the nearest tenth of an inch.
inches
Expert Solution
This question has been solved!
Explore an expertly crafted, step-by-step solution for a thorough understanding of key concepts.

This is a popular solution!

Trending now
This is a popular solution!

Step by step
Solved in 2 steps with 3 images

Recommended textbooks for you

Functions and Change: A Modeling Approach to Coll…
Algebra
ISBN:
9781337111348
Author:
Bruce Crauder, Benny Evans, Alan Noell
Publisher:
Cengage Learning

College Algebra (MindTap Course List)
Algebra
ISBN:
9781305652231
Author:
R. David Gustafson, Jeff Hughes
Publisher:
Cengage Learning
Functions and Change: A Modeling Approach to Coll…
Algebra
ISBN:
9781337111348
Author:
Bruce Crauder, Benny Evans, Alan Noell
Publisher:
Cengage Learning
College Algebra (MindTap Course List)
Algebra
ISBN:
9781305652231
Author:
R. David Gustafson, Jeff Hughes
Publisher:
Cengage Learning

Linear Algebra: A Modern Introduction
Algebra
ISBN:
9781285463247
Author:
David Poole
Publisher:
Cengage Learning

Algebra & Trigonometry with Analytic Geometry
Algebra
ISBN:
9781133382119
Author:
Swokowski
Publisher:
Cengage