Q2: The effect of ideology on political party affiliation in the United States is studied by a national survey in 2016. Ideology is labeled as 1= Extremely liberal, 2= Liberal, 3= Slightly liberal, 4= Moderate, 5= Slightly conservative, 6= Conservative, 7= Extremely conservative) and Political affiliation is labeled by 1= Democrat, 0= Republican. A binary logistic regression model was fit and the following R output was obtained:
Q2: The effect of ideology on political party affiliation in the United States is studied by a national survey in 2016. Ideology is labeled as 1= Extremely liberal, 2= Liberal, 3= Slightly liberal, 4= Moderate, 5= Slightly conservative, 6= Conservative, 7= Extremely conservative) and Political affiliation is labeled by 1= Democrat, 0= Republican. A binary logistic regression model was fit and the following R output was obtained:

College Algebra
7th Edition
ISBN:9781305115545
Author:James Stewart, Lothar Redlin, Saleem Watson
Publisher:James Stewart, Lothar Redlin, Saleem Watson
Chapter1: Equations And Graphs
Section: Chapter Questions
Problem 10T: Olympic Pole Vault The graph in Figure 7 indicates that in recent years the winning Olympic men’s...

Related questions
Question
Solve ,a,b,c,d
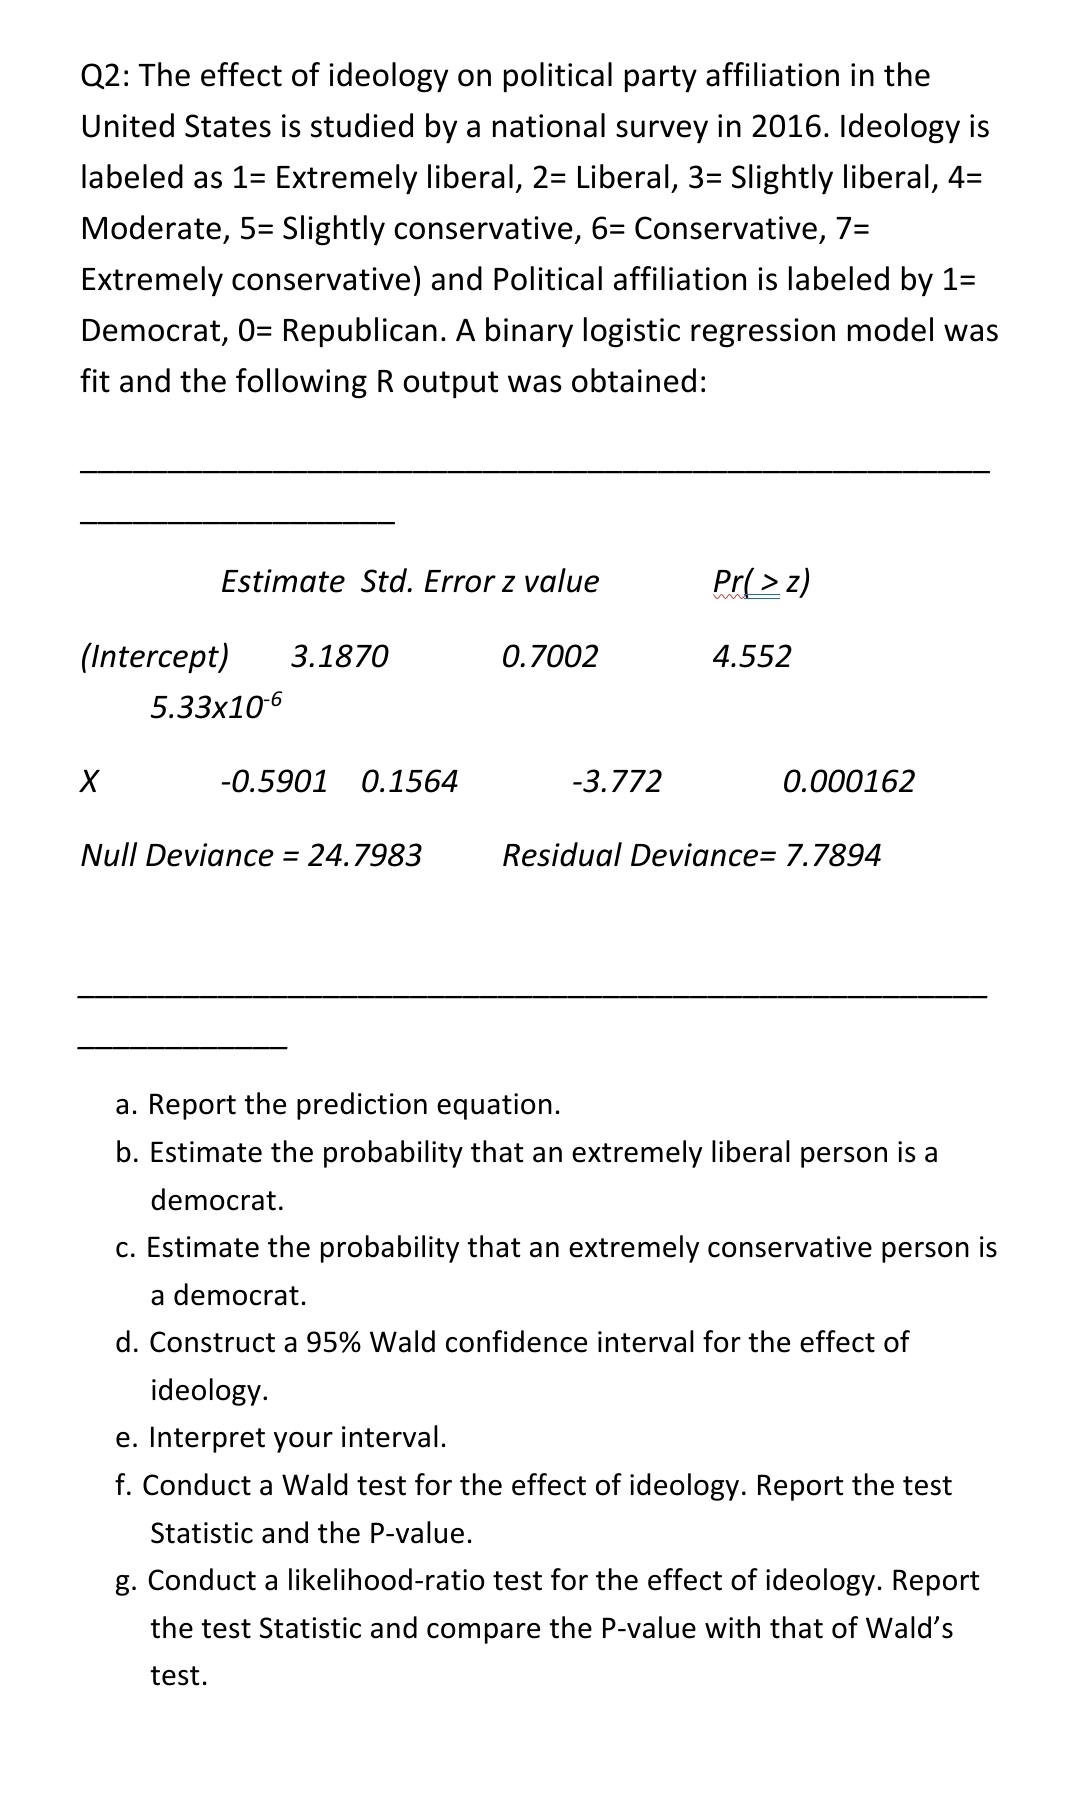
Transcribed Image Text:Q2: The effect of ideology on political party affiliation in the
United States is studied by a national survey in 2016. Ideology is
labeled as 1= Extremely liberal, 2= Liberal, 3= Slightly liberal, 4=
Moderate, 5= Slightly conservative, 6= Conservative, 7=
Extremely conservative) and Political affiliation is labeled by 1=
Democrat, 0= Republican. A binary logistic regression model was
fit and the following R output was obtained:
Estimate Std. Error z value
Pr( > z)
(Intercept)
3.1870
0.7002
4.552
5.33x10⁶
-0.5901 0.1564
-3.772
0.000162
Null Deviance = 24.7983
Residual Deviance= 7.7894
a. Report the prediction equation.
b. Estimate the probability that an extremely liberal person is a
democrat.
c. Estimate the probability that an extremely conservative person is
a democrat.
d. Construct a 95% Wald confidence interval for the effect of
ideology.
e. Interpret your interval.
f. Conduct a Wald test for the effect of ideology. Report the test
Statistic and the P-value.
g. Conduct a likelihood-ratio test for the effect of ideology. Report
the test Statistic and compare the P-value with that of Wald's
test.
Expert Solution
This question has been solved!
Explore an expertly crafted, step-by-step solution for a thorough understanding of key concepts.

This is a popular solution!

Trending now
This is a popular solution!

Step by step
Solved in 2 steps

Recommended textbooks for you
College Algebra
Algebra
ISBN:
9781305115545
Author:
James Stewart, Lothar Redlin, Saleem Watson
Publisher:
Cengage Learning


Linear Algebra: A Modern Introduction
Algebra
ISBN:
9781285463247
Author:
David Poole
Publisher:
Cengage Learning
College Algebra
Algebra
ISBN:
9781305115545
Author:
James Stewart, Lothar Redlin, Saleem Watson
Publisher:
Cengage Learning
Linear Algebra: A Modern Introduction
Algebra
ISBN:
9781285463247
Author:
David Poole
Publisher:
Cengage Learning

Algebra & Trigonometry with Analytic Geometry
Algebra
ISBN:
9781133382119
Author:
Swokowski
Publisher:
Cengage

Glencoe Algebra 1, Student Edition, 9780079039897…
Algebra
ISBN:
9780079039897
Author:
Carter
Publisher:
McGraw Hill