33om) The following scatterplot shows the mean annual carbon dioxide (Co,) in parts per million (ppm) measured at the top of a mountain and the mean annual air temperature over both land and sea across the globe, in degrees Celsius (C). Complete parts a through h on the right. f) View the accompanying scatterplot of the residuals vs. CO2. Does the scatterplot of the residuals vs. CO, show evidence of the violation of any assumptions behind the regression? 16.800 O A. Yes, the outlier condition is violated. 16.725 O B. Yes, the linearity and equal variance assumptions are violated. E 16.650 O C. Yes, the equal variance assumption is violated. 16.575 O D. No, all assumptioris are okay. 16.500 O E. Yes, all the assumptions are violated. 3625 325.0 Co, 350.0 OF. Yes, the linearity assumption is violated. rOgression output. 1264 pnm this vear. What mean temperature does Mean Temperature (*C) 83
33om) The following scatterplot shows the mean annual carbon dioxide (Co,) in parts per million (ppm) measured at the top of a mountain and the mean annual air temperature over both land and sea across the globe, in degrees Celsius (C). Complete parts a through h on the right. f) View the accompanying scatterplot of the residuals vs. CO2. Does the scatterplot of the residuals vs. CO, show evidence of the violation of any assumptions behind the regression? 16.800 O A. Yes, the outlier condition is violated. 16.725 O B. Yes, the linearity and equal variance assumptions are violated. E 16.650 O C. Yes, the equal variance assumption is violated. 16.575 O D. No, all assumptioris are okay. 16.500 O E. Yes, all the assumptions are violated. 3625 325.0 Co, 350.0 OF. Yes, the linearity assumption is violated. rOgression output. 1264 pnm this vear. What mean temperature does Mean Temperature (*C) 83

Glencoe Algebra 1, Student Edition, 9780079039897, 0079039898, 2018
18th Edition
ISBN:9780079039897
Author:Carter
Publisher:Carter
Chapter10: Statistics
Section10.1: Measures Of Center
Problem 9PPS

Related questions
Question
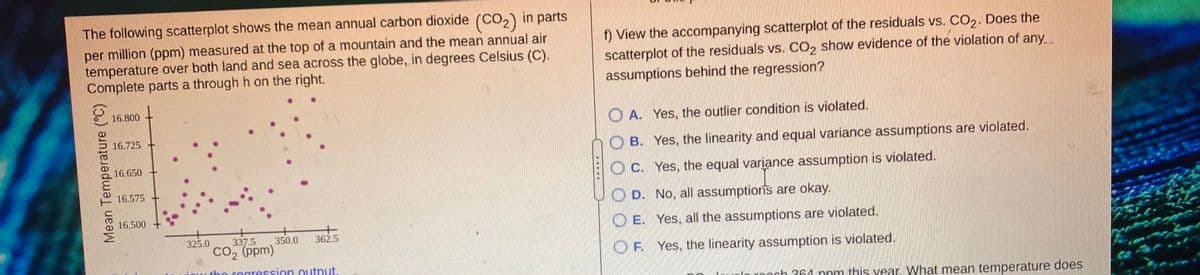
Transcribed Image Text:The following scatterplot shows the mean annual carbon dioxide (CO,) in parts
(CO2)
per million (ppm) measured at the top of a mountain and the mean annual air
temperature over both land and sea across the globe, in degrees Celsius (C).
Complete parts a through h on the right.
f) View the accompanying scatterplot of the residuals vs. CO2. Does the
scatterplot of the residuals vs. CO, show evidence of the violation of any
assumptions behind the regression?
16.800
A. Yes, the outlier condition is violated.
16.725
O B. Yes, the linearity and equal variance assumptions are violated.
16.650
C. Yes, the equal variance assumption is violated.
16.575
O D. No, all assumptioris are okay.
16.500
O E. Yes, all the assumptions are violated.
325.0
337.5
350.0
362.5
CO2 (ppm)
OF
Yes, the linearity assumption is violated.
his vear, What mean temperature does
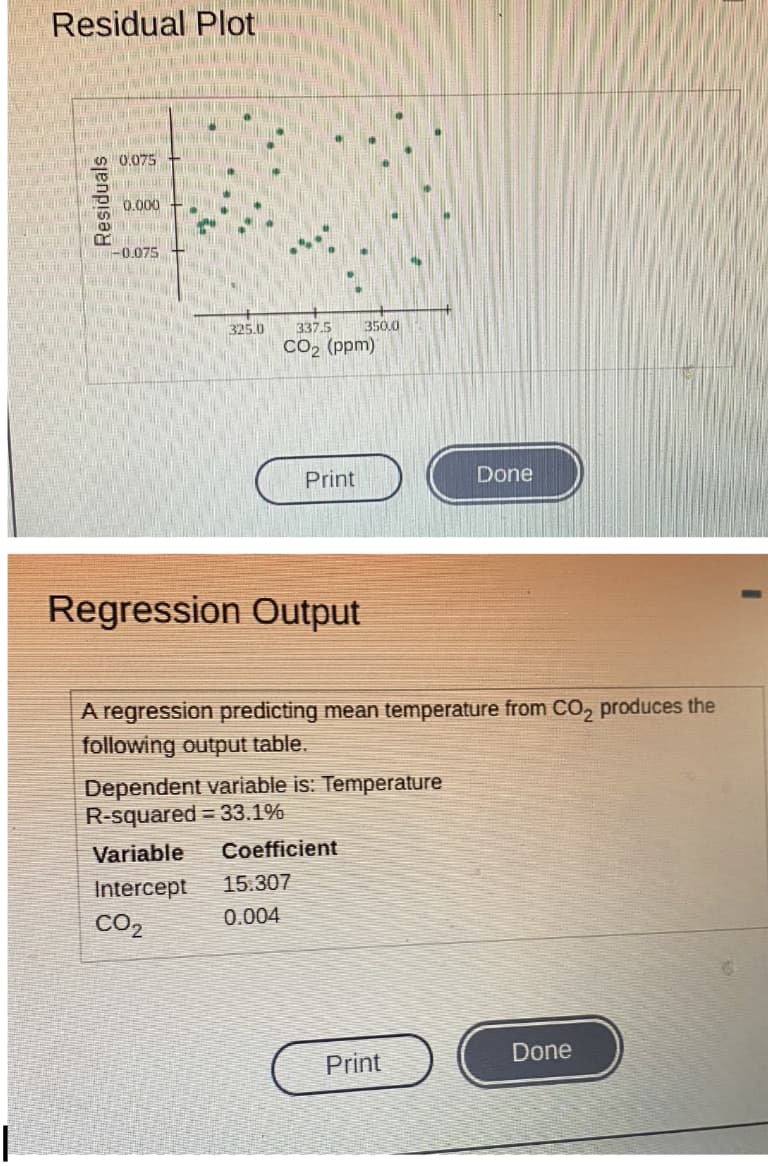
Transcribed Image Text:Residual Plot
S 0,075
0.000
-0.075
325.0
337.5
350.0
CO2 (ppm)
Print
Done
Regression Output
A regression predicting mean temperature from CO, produces the
following output table.
Dependent variable is: Temperature
R-squared = 33.1%
Variable
Coefficient
Intercept
15.307
CO2
0.004
Print
Done
Expert Solution
This question has been solved!
Explore an expertly crafted, step-by-step solution for a thorough understanding of key concepts.

This is a popular solution!

Trending now
This is a popular solution!

Step by step
Solved in 2 steps

Knowledge Booster


Learn more about
Need a deep-dive on the concept behind this application? Look no further. Learn more about this topic, statistics and related others by exploring similar questions and additional content below.Recommended textbooks for you
Glencoe Algebra 1, Student Edition, 9780079039897…
Algebra
ISBN:
9780079039897
Author:
Carter
Publisher:
McGraw Hill
Glencoe Algebra 1, Student Edition, 9780079039897…
Algebra
ISBN:
9780079039897
Author:
Carter
Publisher:
McGraw Hill