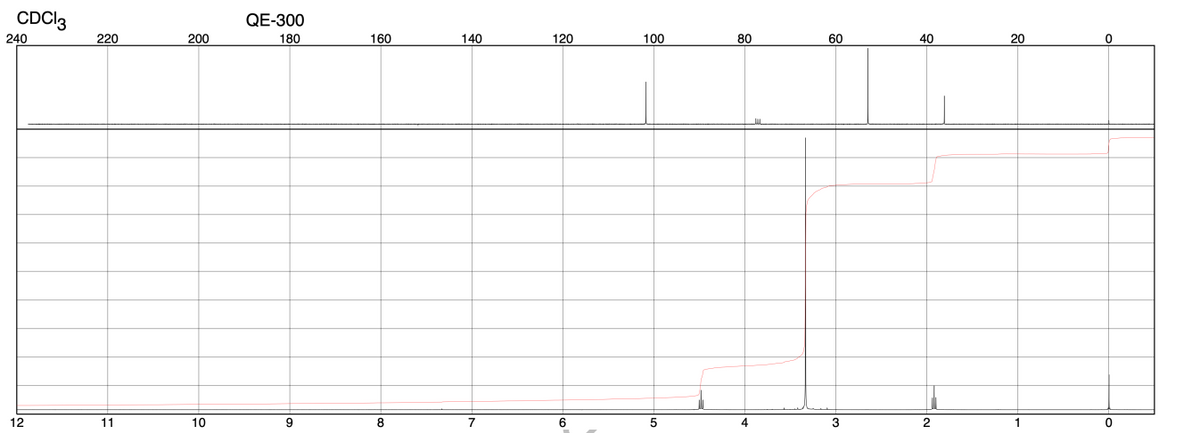
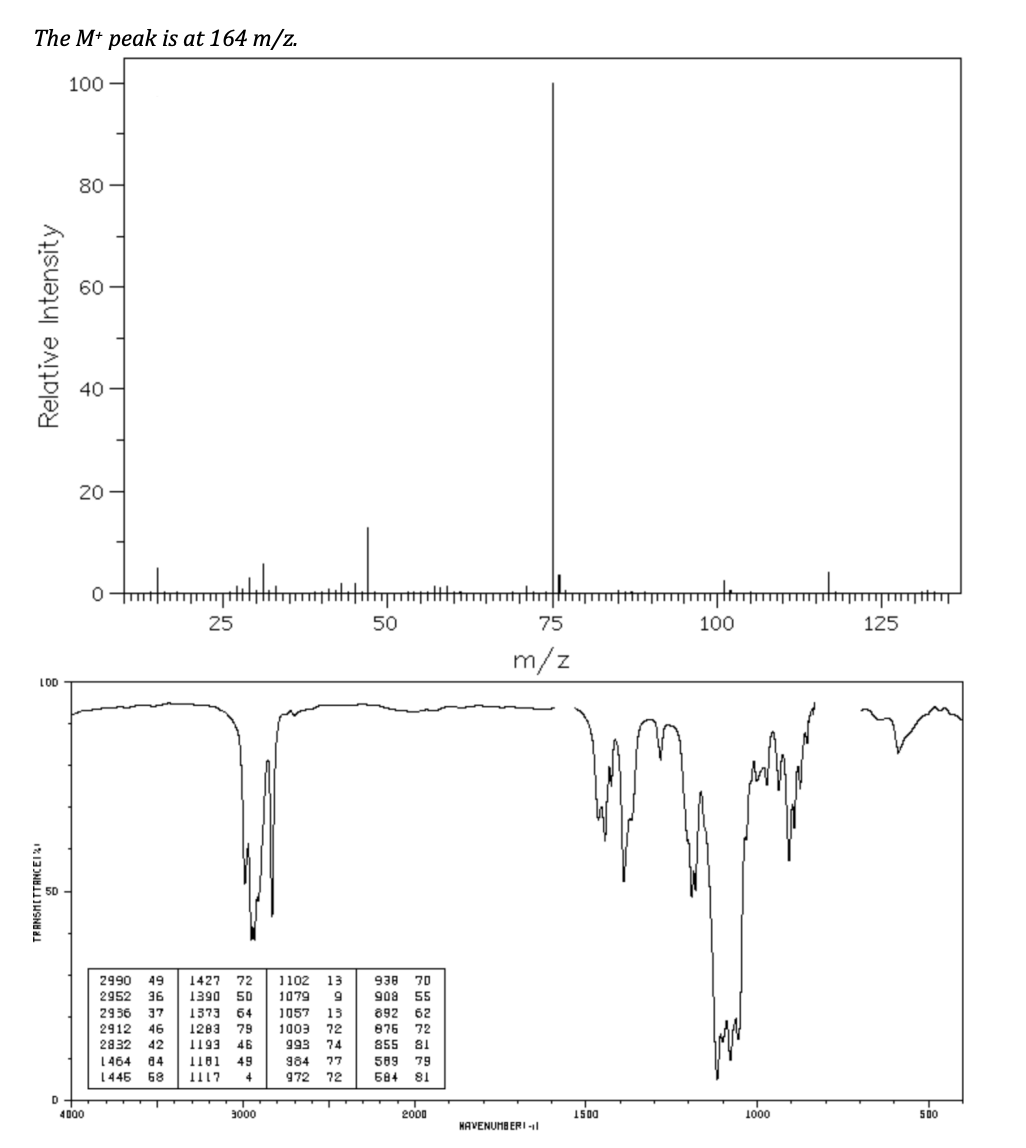
Based on the spectra provided, draw the structure. Label each unique carbon and hydrogen with the letters A, B, C… for use in assigning NMR peaks. fill in the data table assigning peaks in each spectrum. You should assign: • All 1H NMR peaks (do not worry about the peaks for CDCl3 at 7.26 ppm or the peak for TMS at 0 ppm) • Significant IR peaks above 1600 cm

Principles of Instrumental Analysis
7th Edition
ISBN:9781305577213
Author:Douglas A. Skoog, F. James Holler, Stanley R. Crouch
Publisher:Douglas A. Skoog, F. James Holler, Stanley R. Crouch
Chapter28: High-performance Liquid Chromatography
Section: Chapter Questions
Problem 28.6QAP
icon
Related questions
Question

Based on the spectra provided, draw the structure. Label each unique carbon and hydrogen with the letters A, B, C… for use in assigning NMR peaks. fill in the data table assigning peaks in each spectrum. You should assign:

• All 1H NMR peaks (do not worry about the peaks for CDCl3 at 7.26 ppm or the peak for TMS at 0 ppm)

• Significant IR peaks above 1600 cm

Example of what the table should include (imagine the structure of ethanol is drawn with the CH3 hydrogens labeled as A, the CH2 hydrogens labeled as B, and the OH hydrogen labeled as C) : 

hydrogen proton chemical shift  integration splitting pattern couples to..
A 1.2 3 triplet B
B 3.7 2 quartet A
C 2.6 1 singlet -
CDC13
240
12
220
11
200
10
QE-300
180
9
160
8
140
7
120
6
100
5
80
4
60
3
40
2
20
1
0
Transcribed Image Text:CDC13 240 12 220 11 200 10 QE-300 180 9 160 8 140 7 120 6 100 5 80 4 60 3 40 2 20 1 0
The M+ peak is at 164 m/z.
100
Relative Intensity
LOD
TRANSMITTANCE!!
D
80-
60
40
20
4000
0
25
2990 49 1427 72
2952 36
2936 37
2912 46
2832 42
1464 84
1445 68
1102 13
9
1390 50 1079
1373 64
1283 79
1193 46
1181 49
1117 4
3000
1057 13
1003 72
993 74
984 77
972 72
50
|||||
938 70
908 55
892 62
876 72
855 81
589 79
584 81
2000
75
m/z
HAVENUMBERI-11
1500
mm
100
ww
1000
tr
125
500
Transcribed Image Text:The M+ peak is at 164 m/z. 100 Relative Intensity LOD TRANSMITTANCE!! D 80- 60 40 20 4000 0 25 2990 49 1427 72 2952 36 2936 37 2912 46 2832 42 1464 84 1445 68 1102 13 9 1390 50 1079 1373 64 1283 79 1193 46 1181 49 1117 4 3000 1057 13 1003 72 993 74 984 77 972 72 50 ||||| 938 70 908 55 892 62 876 72 855 81 589 79 584 81 2000 75 m/z HAVENUMBERI-11 1500 mm 100 ww 1000 tr 125 500
Expert Solution
trending now

Trending now

This is a popular solution!

steps

Step by step

Solved in 5 steps with 3 images

Blurred answer
Follow-up Questions
Read through expert solutions to related follow-up questions below.
Follow-up Question

can you also include another table with ir data, where one column is wavenumber (cm^-1) and the other column is functional group?

Solution
Bartleby Expert
SEE SOLUTION
Knowledge Booster
NMR Spectroscopy of Organic Molecules
Learn more about
Need a deep-dive on the concept behind this application? Look no further. Learn more about this topic, chemistry and related others by exploring similar questions and additional content below.
Similar questions
  • SEE MORE QUESTIONS
Recommended textbooks for you
Principles of Instrumental Analysis
Chemistry
ISBN:
9781305577213
Author:
Douglas A. Skoog, F. James Holler, Stanley R. Crouch
Publisher:
Cengage Learning
Fundamentals Of Analytical Chemistry
Chemistry
ISBN:
9781285640686
Author:
Skoog
Publisher:
Cengage
Chemistry & Chemical Reactivity
Chemistry
ISBN:
9781337399074
Author:
John C. Kotz, Paul M. Treichel, John Townsend, David Treichel
Publisher:
Cengage Learning
Chemistry & Chemical Reactivity
Chemistry
ISBN:
9781133949640
Author:
John C. Kotz, Paul M. Treichel, John Townsend, David Treichel
Publisher:
Cengage Learning