Census data for the United States between 1790 and 1950 are given in Table. Construct a logistic population model using the data from 1790, 1850, and 1910. (b) Construct a table comparing actual census population with the population predicted by the model in part (a). Compute the error and the percentage error for each entry pair.
Census data for the United States between 1790 and 1950 are given in Table. Construct a logistic population model using the data from 1790, 1850, and 1910. (b) Construct a table comparing actual census population with the population predicted by the model in part (a). Compute the error and the percentage error for each entry pair.

Algebra & Trigonometry with Analytic Geometry
13th Edition
ISBN:9781133382119
Author:Swokowski
Publisher:Swokowski
Chapter10: Sequences, Series, And Probability
Section10.2: Arithmetic Sequences
Problem 67E

Related questions

Question
Census data for the United States between
1790 and 1950 are given in Table. Construct a logistic
population model using the data from 1790, 1850, and 1910.
(b) Construct a table comparing actual census population
with the population predicted by the model in part (a).
Compute the error and the percentage error for each entry
pair.
Transcribed Image Text:O (173) Life Is Beautiful Telugu O x
O Meet - mxh-xxia-eex
O X
A Tutorial 2
b My Tutoring | bartleby
+
i classroom.google.com/c/MjcONTU4MDk1ODI0/a/MjgONjA5Mjl4MjA1/details
* ES
E Apps M Gmail
YouTube
Маps
GE News
* Translate
is applied to an LR-series circuit in which the inductance is 20 henry and the resistance is 2 ohm. Find
the current i(t) if i(0) = 0.
POF vamsi Vignesh - Tutesheet2.pdf
Open with ▼
Problem 8: A 100-volt electromotive force is applied to an RC-series circuit in which the resistance
is 200 ohms, and the capacitance is 10-4 farad. Find the charge q(t) on the capacitor if q(0) = 0. Find
the current i(t).
O Tutorial
Assigned
Problem 9: The number N(t) of people in a community who are exposed to a particular
advertisement is governed by the logistic equation. Initially, N(0) = 5500, and it is observed that
N(1) = 1000. Solve for N(t) if it is predicted that the limiting number of people in the community
Dr. Rishi Asthana
100 points
Vignesh - T.
who will see the advertisement is 50000.
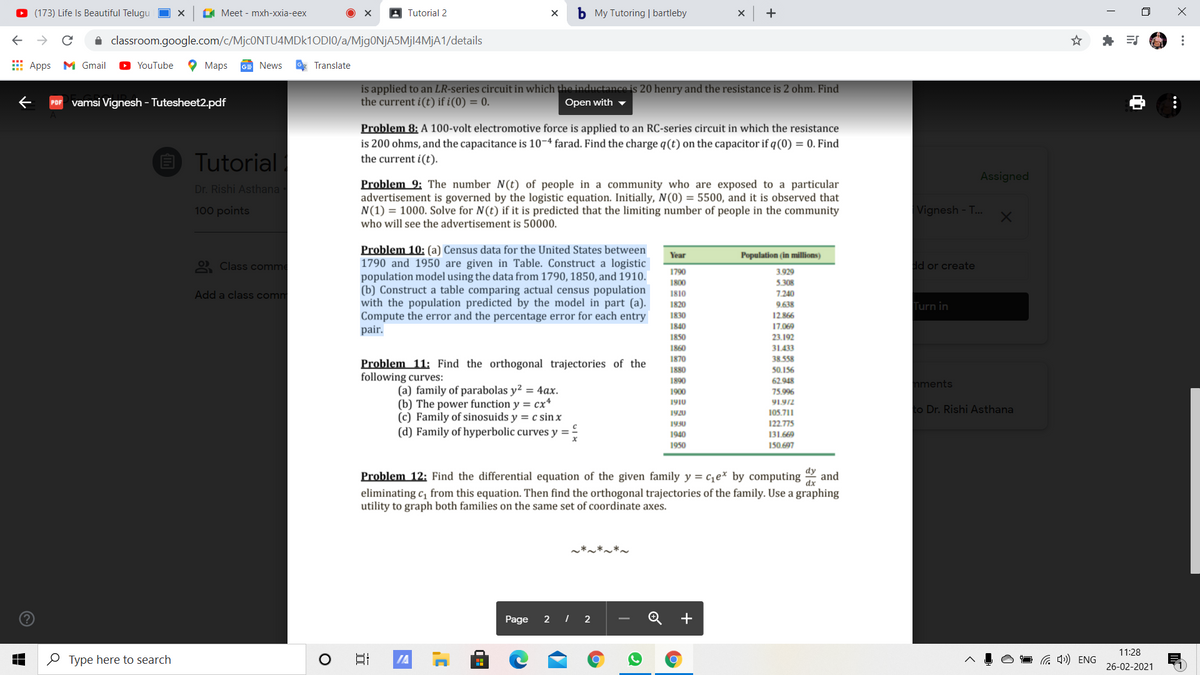
Problem 10: (a) Census data for the United States between
1790 and 1950 are given in Table. Construct a logistic
population model using the data from 1790, 1850, and 1910.
(b) Construct a table comparing actual census population
with the population predicted by the model in part (a).
Compute the error and the percentage error for each entry
pair.
Year
Population (in millions)
2 Class comme
dd or create
1790
3.929
1800
5.308
Add a class comm
1810
7.240
1820
9.638
Turn in
1830
12.866
1840
17.069
1850
23.192
1860
31.433
1870
38.558
Problem 11: Find the orthogonal trajectories of the
following curves:
1880
50.156
1890
1900
62.948
75.996
mments
(a) family of parabolas y² = 4ax.
(b) The power function y = cx*
(c) Family of sinosuids y = c sinx
(d) Family of hyperbolic curves y =
1910
91.972
to Dr. Rishi Asthana
1920
105.711
1930
122.775
1940
131.669
1950
150.697
dy
Problem 12: Find the differential equation of the given family y = c1e* by computing 2 and
dx
eliminating c, from this equation. Then find the orthogonal trajectories of the family. Use a graphing
utility to graph both families on the same set of coordinate axes.
~*~*~*~
Page
2 I 2
+
11:28
O Type here to search
TA
a 4») ENG
26-02-2021
...
Expert Solution
This question has been solved!
Explore an expertly crafted, step-by-step solution for a thorough understanding of key concepts.

This is a popular solution!

Trending now
This is a popular solution!

Step by step
Solved in 7 steps with 7 images

Knowledge Booster


Learn more about
Need a deep-dive on the concept behind this application? Look no further. Learn more about this topic, calculus and related others by exploring similar questions and additional content below.Recommended textbooks for you
Algebra & Trigonometry with Analytic Geometry
Algebra
ISBN:
9781133382119
Author:
Swokowski
Publisher:
Cengage
Algebra & Trigonometry with Analytic Geometry
Algebra
ISBN:
9781133382119
Author:
Swokowski
Publisher:
Cengage