Check My Work (2 
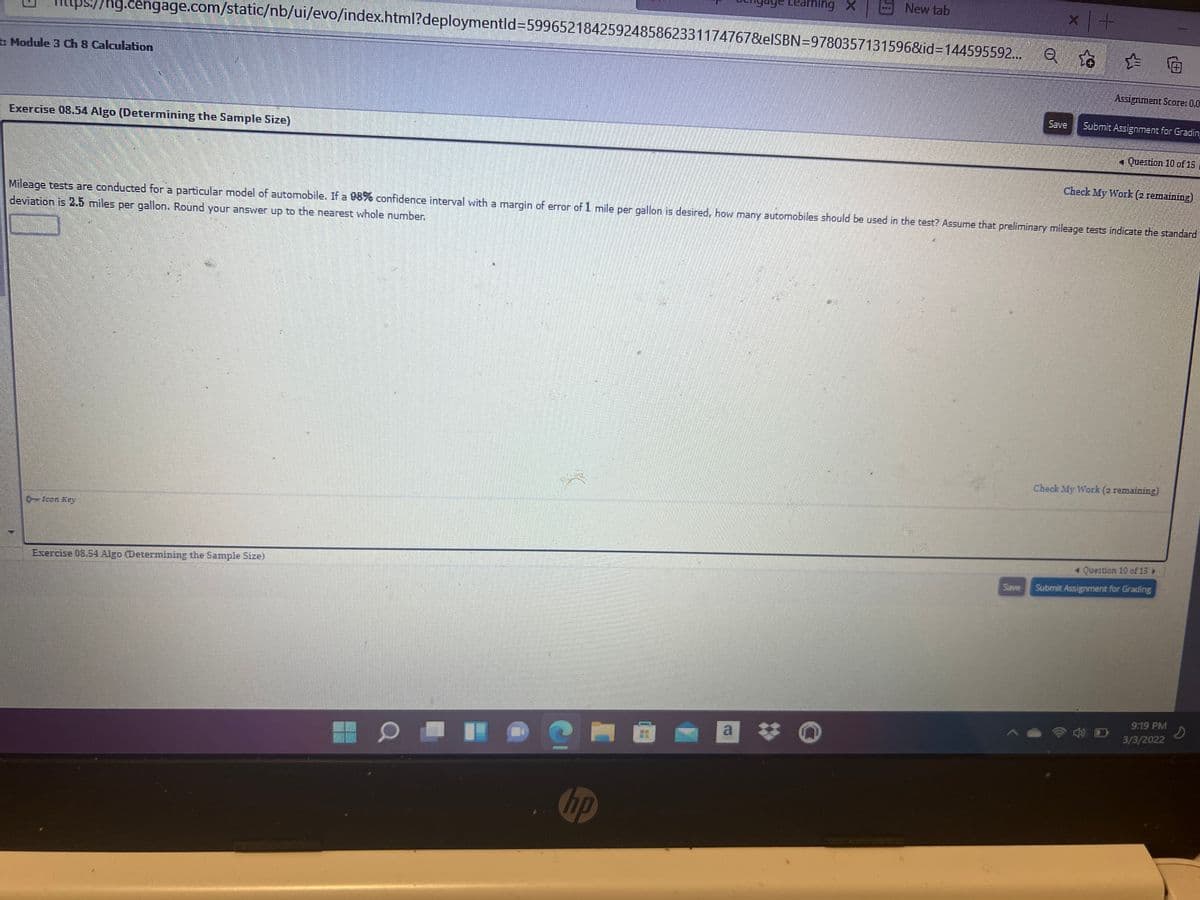
Mileage tests are conducted for a particular model of automobile. If a 98% confidence interval with a margin of error of 1 mile per gallon is desired, how many automobiles should be used in the test? Assume that preliminary mileage tests indicate deviation is 2.5 miles per gallon. Round your answer up to the nearest whole number.
Q: If a random variable X follows normal distribution with mean 10 and standard deviation 50, write dow...
A:
Q: If 5 points were added to each score, then standard deviation of the new scores tyould a) be increas...
A: If 5 points were added to each score,then SD of the new scores would
Q: Attempt the following: (i) P(A) = 0.75, P(B) = 0.50 and P(A U B) = 0.87, are the events A and B inde...
A: Given,P(A)=0.75 , P(B)=0.50 AND P(A∪B)=0.87
Q: a 24-hour call center, complaints arrive at a mean rate of 1 complaint every 3 hours. (a) Find the ...
A:
Q: Below are the jersey numbers of 11 players randomly selected from a football team. Find the range, v...
A:
Q: Let X1,..., Xn an iid random sample from Gamma(a, X). Show that [I-1 X; and E X; are jointly suffici...
A: Given: random variables Xi (i=1,2,....n) are iid from gamma(α,λ) then to show that ∏Xi and ∑Xi is ...
Q: Interpreting technology: The following MINITAB output presents the least-squares regression line for...
A: Given The output from MINITAB is as follows:
Q: If the expected value for a five dollar raffle ticket is $0.85, then there is a 85% chance that the ...
A: here expected vaue is 0.85$ which means player expect to win 0.85$V on each game played on a long ru...
Q: Consider the following diagram, which includes a concave line of best fit: 40,000 US 35,000 -Belgium...
A: From the graph we see that, GDP per worker for USA is greater than Japan. That we say that USA has h...
Q: 6.Given: x¯= 20, µ = 24, σ = 6, and n = 9. Find the z-score. A.2 B.-2 C.-3 D.3
A: Given,x¯=20μ=24σ=6n=9
Q: X If two RVSX and Y are independent, find the pdf ofZ= in terms of the density Y functions of X and ...
A:
Q: Question 4-6. Results of a retrospective case control study of a chronic disease and exposure to a p...
A: Given data Z test Test statistics z = -6.3 P calue = ?
Q: at what number Example 6. If the cost of making x units is C Rupees where c = 10 + 9x of units with ...
A:
Q: D E F K M P Assume X is normal random varaible with mean 50 and sandard deviation 10. P(X>30)= P(40<...
A: As per our guidelines we are suppose to answer only one question. Given,mean(μ)=50standard deviation...
Q: 15. Professor Sigma randomly selects a sample of five test scores from her history class. They are: ...
A:
Q: A sample of 108 mortgages approved during the current year showed that 41 were issued to a single-ea...
A:
Q: Page of Month Actual Sales Naive Forecast - Absolute Value of (# of Product X) Sales Errors (# of Pr...
A:
Q: Suppose (X,Y) is a joint continuous random variable with joint density function, f(x, y) = {cry, for...
A: Given,f(x,y)=cxy ; 1<X<2, 1<y<20 ; otherwise
Q: The numbers of incorrect answers on a twe or false competency test for a random sample of 15 student...
A:
Q: nd the indicated IQ score. The graph to the right depicts IQ scores of adults, and those scores are ...
A:
Q: 8. The graph to the right compares Albacore and Light tuna's mercury content in parts per millions (...
A: Box plot is used to understand the spread of data from the mean. This graph is also known as quartil...
Q: Find the indicated IQ score. The graph to the right depicts IQ scores of adults, and those scores ar...
A: Solution-: Given: μ=100,σ=15 We find x- value=?
Q: Analyzing a Given Study Space Tourism? According to a survey conducted by the Pew Research Center, m...
A: The given data is based on Pew Research Center conducted the survey of more US Adults that if they w...
Q: A dinical trial was conducted to test the effectiveness of a drug for treating insomnia in older sub...
A:
Q: Assuming o is known, find a method of moments estimator of µ. Assuming u is d a method of moments es...
A:
Q: a= 0.1, two tailed test a = 0.5. right-taled test
A: Here use Normal distribution table for z score
Q: Variable N N* Mean SE Mean StDev Minimum Q1 Median Q3 Maximum n=1 1000 0 101.99 3.37 ...
A: Given that X is the amount of time a student spends on homework. Here we have to consider n=144 samp...
Q: A bus service carries 10 000 people daily between Ajax and Union Station and the company has space t...
A:
Q: 12. Compute the amount of information and the redundancy of the following data presented in the tabl...
A:
Q: Give a brief analysis on the graph given in the picture by using the data (Dominant behaviors of rei...
A: From the given graph, The dominant behaviors are given for treatment 1 and treatment 2. From the giv...
Q: Lesson 8 Q5 A ___________ is a useful tool to examine the relationship between categorical variables...
A: Degree of freedom is defined as the number of values that are free to vary in a analysis. A continge...
Q: 11. Based on the data: 1,9, 3, 6, 2, 2, 6, 4, 2, 6, 1 the descriptive statistic of 3.82 is the a. me...
A: Since you have asked multiple questions, we will solve the first question for you. If you want any s...
Q: Annual starting salaries for college graduates with degrees in business administration are generally...
A: For the given data, Find the population standard deviation and sample size for given margin of error...
Q: Question 1: The University of Professional Studies, Accra (UPSA) aims to evaluate students’ acade...
A: Introduction - Descriptive statistics - Descriptive statistics are numbers that are used to summariz...
Q: Compare two weighing techniques (direct weighing and weighing by difference) and determine if there ...
A: Given: Direct Weight Weight By Difference 5.8917 5.8914 5.92 5.92 5.9635 5.9634 5.9639 5....
Q: In Table 2, provide expected proportions for two different MOIS: AD and SLR. The values in this tabl...
A: Please find the solution below. Thank you
Q: 7. A meeting of consuls was attended by 5 Americans and 3 Germans. If three consuls were selected, w...
A:
Q: In a previous election, the confidence interval for the proportion of likely voters who would vote f...
A: given;confidence interval for the proportion;(0.4401, 0.5199)i.e. (p^-E, p^+E)where p^ : point esti...
Q: For this problem, carry at least four digits after the decimal in your calculations. Answers may var...
A: Given,margin of error(E)=0.03α=1-0.80=0.2α2=0.1Z0.1=1.2816 (from Z-table)
Q: The XYZ Corporation is interested in possible differences in days worked by salaried employees in th...
A: applying one way ANOVA on above data: Mean n Std. Dev Variances budgets 257.4 5 11.7388 137.8...
Q: 5. The variance on 17 bags of apples is found to be 5.5. The company that bags the apples claims tha...
A:
Q: A Social Security number consists of nine digits in a particular order, and repetition of digits is ...
A:
Q: State the Five Number Summary for the following dataset. 44 45 46 47 49 51 54 55 58...
A:
Q: playing a gaime p. She wiIS ST Il the Colns comes up neads, and looses omes out talis. She starts wi...
A: Given p=0.6 q=1-0.6 =0.4
Q: Solve the problem below, showing your work for each step by filling-in the blanks. Round all z-score...
A: Let X be the random variable from normal distribution with mean = 25 hours and standard deviation = ...
Q: The probability that an archer hits the target is p = 0.9, so the probability that he misses the tar...
A:
Q: Donot copy chegg answer that is wrong otherwise i dislike it ,,? During the first 14 weeks of a p...
A: The hypotheses are given below: Null hypothesis: H0: p=0.5. Alternative hypothesis: Ha:p>0.5. Sin...
Q: What is the minimum annual total cost (ordering, holding and purchasing) if the buyer places indepen...
A: Solution: Project X Order size Per per unit Purchase cost of 600 units Ordering cost Carrying cost T...
Q: A researcher knows that the weights of 6-year olds are normally distributed withu = 20 kg and o = 3....
A: The random variable is weights of 6-year old follows normal distribution. The population mean is 20 ...
Q: The number of bacteria triples each day. How many bacteria will a sample have after ten days if it s...
A:
Trending now
This is a popular solution!
Step by step
Solved in 2 steps with 2 images
- Child-Proof Bottles. Designing medication packaging that resists opening by children, but yields readily to adults, presents numerous challenges. In the article “Painful Design” (American Scientist, Vol. 93, No. 2, pp. 113–118), H. Petroski examined the packaging used for Aleve, a brand of pain reliever. Three new container designs were given to a panel of children aged 42 months to 51 months. For each design, the children were handed the bottle, shown how to open it, and then left alone with it. If more than 20% of the children succeeded in opening the bottle on their own within 10 minutes, even if by using their teeth, the bottle failed to qualify as child resistant. Identify the a. experimental units. b. response variable. c. factor(s). d. levels of each factor. e. treatments.Samples are collected from the River X and pH values are observed. 9 different pH values are listed in table 3. Table 3 Concentrations 3.55 4.01 5.38 3.22 8.05 5.25 4.67 3.67 3.5Draw box plot and find a. Bowley’s coefficient of skewness b. Karl Pearson’s coefficient of skewness c. Third moment Rubric Stages of Process Marks Imagine and Plan 2Composition 2Effort 1In relation to an evaluation of a natural park you have collected data on the visitors, and obtaineddata for the travel costs and their zones of origin, i.e. basic data needed when applying the TravelCost Method.All visitors come by car and there’s only one person in each car. There are four different zones (Iclose, and IV most far away) and the total cost per person is given in the table below. Give a short explanation of the TCM. Would it be possible to do a reasonable TCM analysis from these data? Zone Travel cost per person($) Total population ineach zone Annual number ofvisitors from eachzone I 10 4000 400 II 15 3000 250 III 20 3500 410 IV 25 4000 450
- Han Samples are collected from the River X and pH values are observed. 9 different pH values are listed in table 3. Table 3 Concentrations 4.2 3.8 6.0 3.5 8.1 4.9 4.1 3.2 4.0Draw box plot and find a. Bowley’s coefficient of skewness b. Karl Pearson’s coefficient of skewness c. Third momentPART D,E,F A researcher wants to compare three different exercise programs. For each program, five volunteers follow it for a month and their weight losses are recorded below. Use a 0.01 significance level to test the claim that the three different exercise programs produce the same mean weight loss Program A: 2.5 8.8 7.3 9.8 5.1 Program B: 5.8 4.9 1.1 7.8 1.2 Program C: 4.3 6.2 5.8 8.1 7.9 a. Define the parameter(s) A. mu 1 equals The mean weight loss by the 5 people on program A mu 2 equals The mean weight loss by the 5 people on program B mu 3 equals The mean weight loss by the 5 people on program C B. mu 1 equals The mean weight loss by all people on program A mu 2 equals The mean weight loss by all people on program B mu 3 equals The mean weight loss by all people on program C C. mu equals The mean weight loss for all people D. p 1 equals The mean…Site image for background. Conduct a test of the null hypothesis H0: u1=u2=u3=u4=u5 by stating (i) a test statistic value, (ii) an associate p-value, (iii) a decision at the a = 0.05 level, and (iv) a conclusion formulated in terms of Ha here for feed rate groups.
- The Coruro’s Burrow. The subterranean coruro (Spalacopus cyanus) is a social rodent that lives in large colonies in underground burrows that can reach lengths of up to 600 meters. Zoologists S. Begall and M. Gallardo studied the characteristics of the burrow systems of the subterranean coruro in central Chile and published their findings in the paper “Spalacopus cyanus (Rodentia: Octodontidae): An Extremist in Tunnel Constructing and Food Storing among Subterranean Mammals” (Journal of Zoology, Vol. 251, pp. 53–60). A sample of 51 burrows had the depths, in centimeters (cm), presented on the WeissStats site. Use the technology of your choice to do the following. a. Obtain a normal probability plot, boxplot, histogram, and stemand-leaf diagram of the data. b. Based on your results from part (a), can you reasonably apply the t-interval procedure to the data? Explain your reasoning. c. Find and interpret a 90% confidence interval for the mean depth of all subterranean coruro burrows.The measurement of spread or scatter of the individual values around the central point is called: a. Measures of kurtosis b. Measures of dispersion c. mean d. Measures of skewnessWe have a table of cities and temperatures. Use 1 Way fixed-effects ANOVA tocalculate the F value showing your work.city temperatureOrlando 70Orlando 65Orlando 60Orlando 65Dallas 75Dallas 65Dallas 60Dallas 60Chicago 50Chicago 50Chicago 40Chicago 40The null hypothesis is H0 : µOrlando = µDallas = µChicago
- Wild irises are beautiful flowers found throughout the United States, Canada, and northern Europe. This problem concerns the length of the sepal (leaf-like part covering the flower) of different species of wild iris. Data are based on information taken from an article by R. A. Fisher in Annals of Eugenics (Vol. 7, part 2, pp. 179 -188). Measurements of sepal length in centimeters from random samples of Iris setosa (I), Iris versicolor (II), and Iris virginica (III) are as follows below. I II III 5.5 5.2 6.7 4.4 6.5 5.7 5.2 6.9 4.1 5.9 4.4 7.8 4.3 5.5 5.7 5.3 6.4 6.1 5.8 5.5 6.9 Shall we reject or not reject the claim that there are no differences among the population means of sepal length for the different species of iris? Use a 10% level of significance. (a) What is the level of significance? (b) Find SSTOT, SSBET, and SSW and check that SSTOT = SSBET + SSW. (Use 3 decimal places.) SSTOT = ? SSBET = ? SSW = ? Find d.f.BET, d.f.W, MSBET, and…Wild irises are beautiful flowers found throughout the United States, Canada, and northern Europe. This problem concerns the length of the sepal (leaf-like part covering the flower) of different species of wild iris. Data are based on information taken from an article by R. A. Fisher in Annals of Eugenics (Vol. 7, part 2, pp. 179 -188). Measurements of sepal length in centimeters from random samples of Iris setosa (I), Iris versicolor (II), and Iris virginica (III) are as follows below. I II III 5.5 5.2 6.8 4.6 6.5 5.3 5.1 6.1 4.4 5.5 4.1 7.9 4.1 5.1 5.9 5.4 6.1 6.9 5.4 5.1 6.6 Shall we reject or not reject the claim that there are no differences among the population means of sepal length for the different species of iris? Use a 5% level of significance. (a) What is the level of significance?State the null and alternate hypotheses. Ho: ?1 = ?2 = ?3; H1: Exactly two means are equal.Ho: ?1 = ?2 = ?3; H1: Not all the means are equal. Ho: ?1 = ?2 = ?3; H1:…Wild irises are beautiful flowers found throughout the United States, Canada, and northern Europe. This problem concerns the length of the sepal (leaf-like part covering the flower) of different species of wild iris. Data are based on information taken from an article by R. A. Fisher in Annals of Eugenics (Vol. 7, part 2, pp. 179 -188). Measurements of sepal length in centimeters from random samples of Iris setosa (I), Iris versicolor (II), and Iris virginica (III) are as follows below. I II III 5.7 5.4 6.8 4.1 6.3 5.4 5.0 6.7 4.4 5.4 4.3 7.3 4.6 5.5 5.3 5.7 6.5 6.7 5.2 5.3 6.8 Shall we reject or not reject the claim that there are no differences among the population means of sepal length for the different species of iris? Use a 5% level of significance. (a) What is the level of significance?State the null and alternate hypotheses. Ho: ?1 = ?2 = ?3; H1: All three means are different.Ho: ?1 = ?2 = ?3; H1: Not all the means are equal. Ho: ?1 = ?2 = ?3;…