Choose one of the answer options below: D. Since it is close to normal with a smaller standard deviation C. Since it is still bimodal with a similar standard deviation B. Since it is close to normal with a similar sta
Choose one of the answer options below: D. Since it is close to normal with a smaller standard deviation C. Since it is still bimodal with a similar standard deviation B. Since it is close to normal with a similar sta

Glencoe Algebra 1, Student Edition, 9780079039897, 0079039898, 2018
18th Edition
ISBN:9780079039897
Author:Carter
Publisher:Carter
Chapter10: Statistics
Section10.4: Distributions Of Data
Problem 19PFA

Related questions
Question
See image for question.
Choose one of the answer options below:
D. Since it is close to normal with a smaller standard deviation
C. Since it is still bimodal with a similar standard deviation
B. Since it is close to normal with a similar standard deviation
A. Since it is still bimodal but with a smaller standard deviation
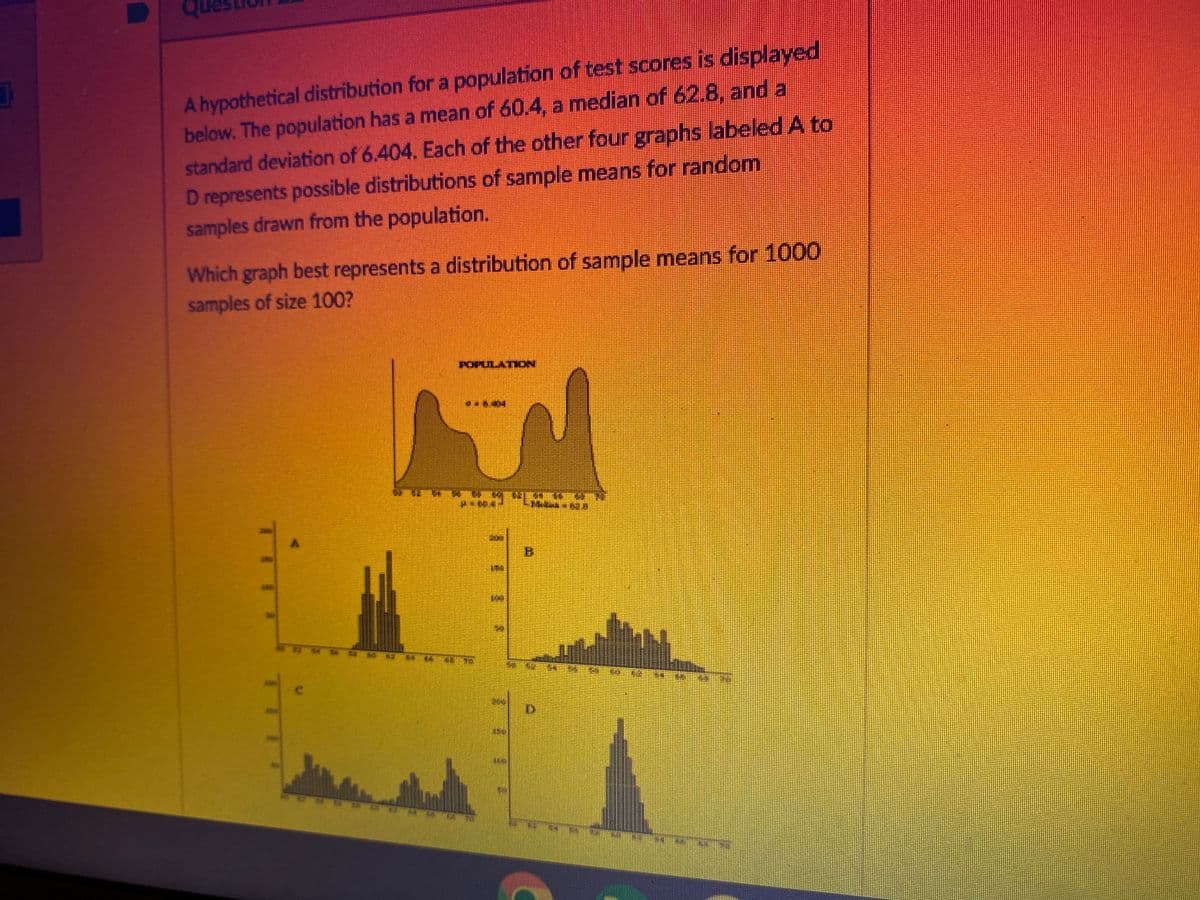
Transcribed Image Text:A hypothetical distribution for a population of test scores is displayed
below. The population has a mean of 60.4, a median of 62.8, and a
standard deviation of 6.404. Each of the other four graphs labeled A to
D represents possible distributions of sample means for random
samples drawn from the population.
Which graph best represents a distribution of sample means for 1000
samples of size 100?
POPULAT
7
M
B
11
Expert Solution
This question has been solved!
Explore an expertly crafted, step-by-step solution for a thorough understanding of key concepts.

Step by step
Solved in 2 steps

Recommended textbooks for you
Glencoe Algebra 1, Student Edition, 9780079039897…
Algebra
ISBN:
9780079039897
Author:
Carter
Publisher:
McGraw Hill
Glencoe Algebra 1, Student Edition, 9780079039897…
Algebra
ISBN:
9780079039897
Author:
Carter
Publisher:
McGraw Hill