Choose the alternative that best answer the questions: I. Perfect multicollinearity occurs when the correlation coefficient between two independent variable is zero or closer to zero. II. Perfect multicollinearity will produce unbiased estimates III. Perfect multicollinearity will produce estimates with higher variance IV. Perfect multicollinearity should be ignored in the regression model and all variables should be kept in the model. O Only I is TRUE O ALL are TRUE O Only IV is TRUE O Only Il and III are TRUE
Choose the alternative that best answer the questions: I. Perfect multicollinearity occurs when the correlation coefficient between two independent variable is zero or closer to zero. II. Perfect multicollinearity will produce unbiased estimates III. Perfect multicollinearity will produce estimates with higher variance IV. Perfect multicollinearity should be ignored in the regression model and all variables should be kept in the model. O Only I is TRUE O ALL are TRUE O Only IV is TRUE O Only Il and III are TRUE

Glencoe Algebra 1, Student Edition, 9780079039897, 0079039898, 2018
18th Edition
ISBN:9780079039897
Author:Carter
Publisher:Carter
Chapter10: Statistics
Section10.3: Measures Of Spread
Problem 1GP

Related questions
Question
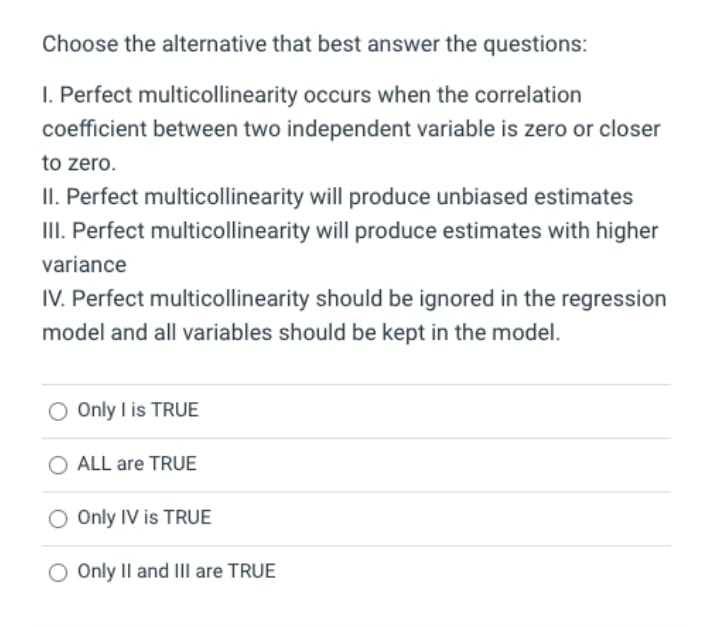
Transcribed Image Text:Choose the alternative that best answer the questions:
I. Perfect multicollinearity occurs when the correlation
coefficient between two independent variable is zero or closer
to zero.
II. Perfect multicollinearity will produce unbiased estimates
II. Perfect multicollinearity will produce estimates with higher
variance
IV. Perfect multicollinearity should be ignored in the regression
model and all variables should be kept in the model.
O Only I is TRUE
ALL are TRUE
Only IV is TRUE
O Only Il and III are TRUE
Expert Solution
This question has been solved!
Explore an expertly crafted, step-by-step solution for a thorough understanding of key concepts.

Step by step
Solved in 3 steps

Recommended textbooks for you
Glencoe Algebra 1, Student Edition, 9780079039897…
Algebra
ISBN:
9780079039897
Author:
Carter
Publisher:
McGraw Hill
Glencoe Algebra 1, Student Edition, 9780079039897…
Algebra
ISBN:
9780079039897
Author:
Carter
Publisher:
McGraw Hill