(CIMA, adapted) Catherine McCarthy, sales manager of Baxter Arenas, is checking to see if there is any relationship between promotional costs and ticket rev- enues at the sports stadium. She obtains the following data for the past 9 months: Promotional Costs $52,000 65,000 80,000 Month Ticket Revenues April May June $200,000 270,000 320,000 480,000 July August September 90,000 100,000 110,000 430,000 450,000 October 540,000 120,000 November 670,000 180,000 197,000 December 751,000 She estimates the following regression equation: Ticket revenues = $65,583 + ($3.54 x Promotional costs)
(CIMA, adapted) Catherine McCarthy, sales manager of Baxter Arenas, is checking to see if there is any relationship between promotional costs and ticket rev- enues at the sports stadium. She obtains the following data for the past 9 months: Promotional Costs $52,000 65,000 80,000 Month Ticket Revenues April May June $200,000 270,000 320,000 480,000 July August September 90,000 100,000 110,000 430,000 450,000 October 540,000 120,000 November 670,000 180,000 197,000 December 751,000 She estimates the following regression equation: Ticket revenues = $65,583 + ($3.54 x Promotional costs)

Cornerstones of Cost Management (Cornerstones Series)
4th Edition
ISBN:9781305970663
Author:Don R. Hansen, Maryanne M. Mowen
Publisher:Don R. Hansen, Maryanne M. Mowen
Chapter14: Quality And Environmental Cost Management
Section: Chapter Questions
Problem 21E: At the end of 20x5, Bing Pharmaceuticals began to implement an environmental quality management...

Related questions
Question
Plot the relationship between promotional costs and ticket revenues. Also draw the regression line and evaluate it using the criteria of economic plausibility, goodness of fit, and slope of the regression line.
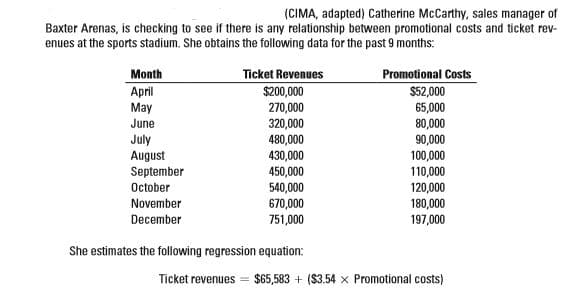
Transcribed Image Text:(CIMA, adapted) Catherine McCarthy, sales manager of
Baxter Arenas, is checking to see if there is any relationship between promotional costs and ticket rev-
enues at the sports stadium. She obtains the following data for the past 9 months:
Promotional Costs
$52,000
65,000
80,000
Month
Ticket Revenues
April
May
June
$200,000
270,000
320,000
480,000
July
August
September
90,000
100,000
110,000
430,000
450,000
October
540,000
120,000
November
670,000
180,000
197,000
December
751,000
She estimates the following regression equation:
Ticket revenues =
$65,583 + ($3.54 x Promotional costs)
Expert Solution
This question has been solved!
Explore an expertly crafted, step-by-step solution for a thorough understanding of key concepts.

This is a popular solution!

Trending now
This is a popular solution!

Step by step
Solved in 2 steps with 4 images

Knowledge Booster


Learn more about
Need a deep-dive on the concept behind this application? Look no further. Learn more about this topic, accounting and related others by exploring similar questions and additional content below.Recommended textbooks for you
Cornerstones of Cost Management (Cornerstones Ser…
Accounting
ISBN:
9781305970663
Author:
Don R. Hansen, Maryanne M. Mowen
Publisher:
Cengage Learning

Managerial Accounting: The Cornerstone of Busines…
Accounting
ISBN:
9781337115773
Author:
Maryanne M. Mowen, Don R. Hansen, Dan L. Heitger
Publisher:
Cengage Learning

Principles of Accounting Volume 2
Accounting
ISBN:
9781947172609
Author:
OpenStax
Publisher:
OpenStax College
Cornerstones of Cost Management (Cornerstones Ser…
Accounting
ISBN:
9781305970663
Author:
Don R. Hansen, Maryanne M. Mowen
Publisher:
Cengage Learning
Managerial Accounting: The Cornerstone of Busines…
Accounting
ISBN:
9781337115773
Author:
Maryanne M. Mowen, Don R. Hansen, Dan L. Heitger
Publisher:
Cengage Learning
Principles of Accounting Volume 2
Accounting
ISBN:
9781947172609
Author:
OpenStax
Publisher:
OpenStax College

Managerial Accounting
Accounting
ISBN:
9781337912020
Author:
Carl Warren, Ph.d. Cma William B. Tayler
Publisher:
South-Western College Pub

Principles of Cost Accounting
Accounting
ISBN:
9781305087408
Author:
Edward J. Vanderbeck, Maria R. Mitchell
Publisher:
Cengage Learning

Essentials of Business Analytics (MindTap Course …
Statistics
ISBN:
9781305627734
Author:
Jeffrey D. Camm, James J. Cochran, Michael J. Fry, Jeffrey W. Ohlmann, David R. Anderson
Publisher:
Cengage Learning