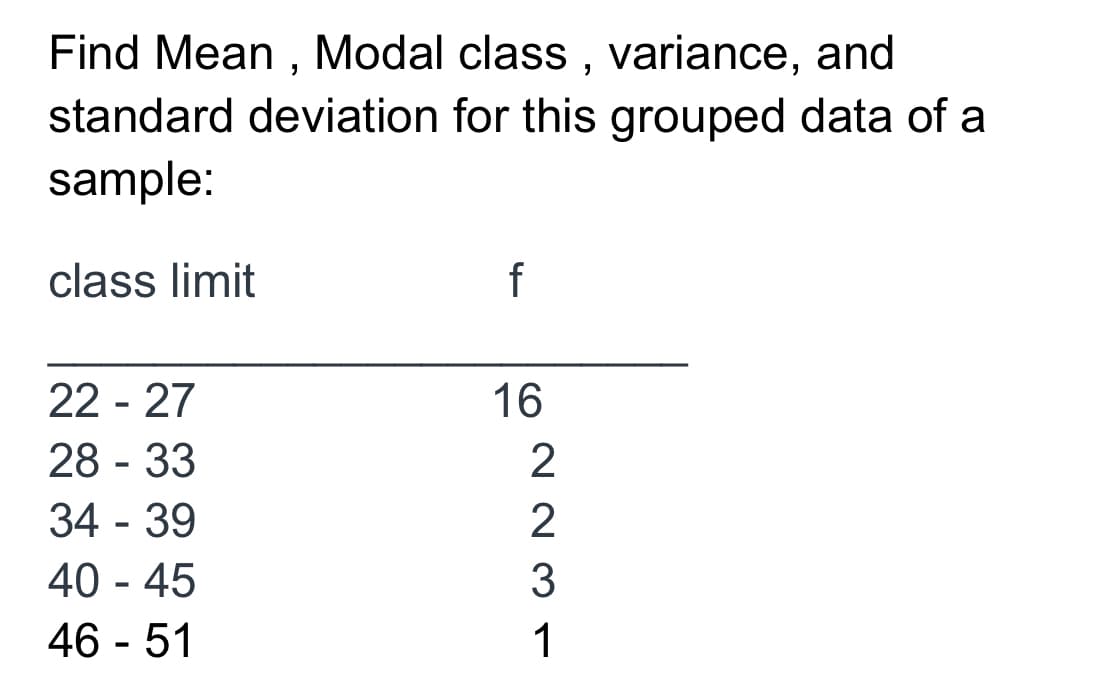
Find Mean , Modal class , variance, and standard deviation for this grouped data of a sample: class limit f 22 - 27 28 - 33 16 2 34 - 39 40 - 45 46 - 51 1


Q: 4. Find mean value of the given data. Scores Frequency (f) 41-45 36-40 8 31-35 26-30 14 21-25 16-20
A: Score and frequency are the given information, We have to form a table , Score Frequency (fi)…
Q: The following data represents the age distribution of a sample of 100 people covered by Health…
A: Given: Age Number (f) 25-34 23 35-44 29 45-54 28 55-64 20
Q: Q) Consider the following data: 47 34 38 38 20 33 9 36 2 14 33 43 3. 42 35 16 48 22 20 39 40 10 25…
A: Note: Since you have posted a question with multiple sub-parts, we will solve the first three…
Q: * :Determine the Variance for the data in the table below Classes Frequency 4.3-4.39 2 4.4 - 4.49…
A:
Q: For each set of data: Compute the following: a.) mean, median, and mode. b.) Compute the variance,…
A: Obtaining descriptive statistics for the first data set: The procedure to obtain descriptive…
Q: Calculate the sample mean and sample variance for the following frequency distribution of final exam…
A:
Q: Value | Frequency 27 96 58 3 54 4 18 7
A:
Q: Compute for the mean, median, mode, range, variance and standard deviation for the table below.…
A: Given: Class Interval f 70-72 2 67-69 2 64-66 4 61-63 5 58-60 11 55-57 8 52-54 4…
Q: a) Frequency (f) fx X? efi 15 6 90 1350 225 6 20 11 220 4400 400 17 25 17 425 10625 625 34 30 24 720…
A: Note: "Since you have posted a question with multiple sub -parts, we will solve first three sub…
Q: A population of grades for a statistics class of six students is given below: 90 65 70 85 86 70 Find…
A: given data : 90,65,70,85,86,70
Q: The math grades of the 40 students in a class are given by the table X₁ 2 3 4 5 6 7 8 9 F₁ 1 3 5 6 9…
A: Solution-: Given data: xi 1 2 3 4 5 6 7 8 9 10 fi 1 1 3 5 6 9 8 2 3 2 We want to find (a)…
Q: Find the mean, variance and standard deviation of the following data: X 19 20 21 22 23 P(X) 0.2 0.2…
A: The table shows the X values and its probabilities values.
Q: Determine the Mean, Range, Mean Deviation, Sample Variance, Sample Standard Deviation and…
A: To determine the mean, range, mean deviation, sample variance, sample standard deviation and…
Q: This data is from a sample. Calculate the mean, standard deviation, and coefficient of variation.…
A: Number of samples (n) = 7 X 48.3 29.6 16.8 42.9 41.4 13.2 29.5
Q: 1b) Calculate the mean deviation from the mean for the following data: Size : 4 8. 10 12 14 16…
A: We have given that, Date set in the form of size and frequency is, Xi = 2 4 6 8 10…
Q: Using the constructed grouped frequency distribution below, find the following: D. range E. variance…
A:
Q: Use the data set of years of employment in the simple random sample of local residents 20 18 23 30…
A: Given data is 20,18, 23,30, 20 , 9, 25 , 15 , 8 , 11 ,34Arrange the given data in ascending order 8,…
Q: Find the standard deviation for the grouped data. College Units Frequency 0-24 4 25-49 3 50-74 6…
A: Here we use simple method which is used to find deviation
Q: Find the range, variance and standard deviation of the following grouped data. 1. The following…
A:
Q: Using the given data (population) below, compute the following statistics: 47 72…
A:
Q: a)Find the mean for the following group data. b) Find the standard deviation for the following group…
A:
Q: the standard deviation of the data in following distribution: 12 13 14 32 15 21 16 15 17 8 13 20
A:
Q: The data below is the ages of a population of 30 residents at a condominium. 28 34…
A: Note: Hey there! Thank you for the question. As you have posted a question with multiple sub-parts,…
Q: Determine the Mean, Range, Mean Deviation, Sample Variance, Sample Standard Deviation and…
A:
Q: The following data set shows the frequencies of the grouped scores for the 2008 Masters Golf…
A: Given data, Classes Midpoint (Mi) Frequencies (fi) Mi*fi 280-283 281.5 2 281.5*2=563 284-287…
Q: consider the two groups of scores: group c 5 12 20 20 20 20 20 22 group d 2 3 4 5 6 14 15 16…
A: Group C (X) Group D (Y) (X-xbar)^2 (y-ybar)^2 5 2 153.1406 37.51563 12 3 28.89063 26.26563 20…
Q: :- Find the mean absolute deviation (M.A.D.), standard deviation (S), and coefficient of variance…
A:
Q: Find Standard Deviation for the following frequency distribution 10 11 12 13 14 Total 3 12 18 12 48
A:
Q: The following table gives the grouped frequency distribution of the crime rates in 25 different…
A: Class limit Frequency(f) mid points(x) fx 34-96 13 65 845 97-159 2 128 256 160-222 0 191 0…
Q: Show first the Mean, Median and Mode using Frequency Distribution. Solve for Q, P88, D10, Variance,…
A: From the provided , following table is constructed : Frequency : It is the number of times a value…
Q: 5.Consider the following frequency distribution below. Classes f…
A: From the given information, the required calculations can be done as follows: A=49 CI fi…
Q: Find the sample mean, sample variance, and sample standard deviation of the given data set: 1. 4 10…
A:
Q: Given the following sample data in a grouped frequency distribution Data Frequency 40 - 44 45 - 49 4…
A: Solution-: We find, (a) The mean=? (b) The standard deviation =? (c) Shape of the distribution
Q: Find the coefficient of variation (CV) of the following data using sample variance. Use 3 decimal…
A:
Q: . Find the mean, median mode and standard deviation of the following set of data: CLASS INTERVAL f…
A: Introduction: Weighted Mean: The weighted mean is defined as, Mean=∑iwi xi∑iwi For the continuous…
Q: 4. Find mean value of the given data. Scores Frequency (f) 41-45 1 36-40 31-35 26-30 14 21-25 16-20
A: The table helps to find the mean value. Scores Frequency mid point fx 41-45 1 43 43 36-40 8…
Q: Find the coefficient of variation (CV) of the following data using sample variance. Use 3 decimal…
A:
Q: 2) in a spot speed study for a highway section, the data were collected and shown in the table…
A: As per guidelines we will only answer first three subparts, please repost other subparts for more…
Q: Find the mean, median and all modes for the data in the given frequency distribution. Age 7…
A: We use a grouped frequency data: We do the calculations using Excel.
Q: Q2/ The number of faculty listed for a variety of private colleges that offer only bachelor's…
A: The number of faculty listed for a variety of private colleges that offer only bachelor's degrees is…
Q: The data below represent the prices of different items in a supermarket, construct the frequency…
A: Note: Since we only answer up to 3 sub-parts, we'll answer the first 3. Please resubmit the…
Q: Consider the data in the following frequency distribution. Assume the data represent a population.…
A: Given that, Assume the data as a population: class frequency 2-6 2 7-11 3…
Q: Q) Consider the following ungrouped data: 18 11 22 19 24 24 23 10 11 16…
A: Mean is the average value around which the whole data set is concentrated. Mean for the set of 'n'…
Q: Q2. Find the mean deviation, standard deviation and variance for the following frequency…
A:
Q: Refer to the frequency distribution below that summarizes the numbers of chocolate chips found in…
A:
Q: • Compute for the range, the mean deviation, and the standard of each set of grouped data. Scores of…
A: Given that
Q: Calculate the mean, standard deviation and variance for the following frequency distribution. 40-50…
A: The grouped data information provided, with the corresponding frequencies is shown in the table…
Q: Find the median and meản deviation of the following data : Size Frequency Şize Frequency 0-10 7…
A:
Q: Find the range, quartile deviation, mean deviation about the mean, mean deviation about the median,…
A: given , class frequency 2-4 2 4-6 5 6-8 4 8-10 7 Total 18


Step by step
Solved in 3 steps


- The number of eggs that a female fly lays in her lifetime is normally distributed with a mean of 800 eggs and a standard deviation of 100 eggs. If a random sample of 15 flies is chosen, find the mean and standard eror of the mean using the Central Limit Theorem.Use the central limit theorem to find the mean and standard error of the mean of the indicated sampling distribution. Then sketch a graph of the sampling distribution. The per capita consumption of red meat by people in a country in a recent year was normally distributed, with a mean of 109 pounds and a standard deviation of 37.9pounds. Random samples of size are drawn from this population and the mean of each sample is determined.Use the central limit theorem to find the mean and standard error of the mean of the indicated sampling distribution. Then sketch a graph of the sampling distribution. The per capita consumption of red meat by people in a country in a recent year was normally distributed, with a mean of 106 pounds and a standard deviation of 38.6 pounds. Random samples of size 17 are drawn from this population and the mean of each sample is determined. Ux = Standard deviation =
- Use the central limit theorem to find the mean and standard error of the mean of the indicated sampling distribution. Then sketch a graph of the sampling distribution. The per capita consumption of red meat by people in a country in a recent year was normally distributed, with a mean of 109pounds and a standard deviation of 37.9 pounds. Random samples of size 19 are drawn from this population and the mean of each sample is determined. μx= σx=Use the central limit theorem to find the mean and standard error of the mean of the indicated sampling distribution. Then sketch a graph of the sampling distribution. The per capita consumption of red meat by people in a country in a recent year was normally distributed, with a mean of 102 pounds and a standard deviation of 37.1 pounds. Random samples of size 17 are drawn from this population and the mean of each sample is determined.Use the Central Limit Theorem to find the mean and standard error of the mean of the indicated sampling distribution. The amounts of time employees of a telecommunications company have worked for the company are normally distributed with a mean of 5.90 years and a standard deviation of 1.80 years. Random samples of size 14 are drawn from the population and the mean of each sample is determined. Round the answers to the nearest hundredth.
- Use the central limit theorem to find the mean and standard error of the mean of the indicated sampling distribution. Then sketch a graph of the sampling distribution. The per capita consumption of red meat by people in a country in a recent year was normally distributed, with a mean of 114 pounds and a standard deviation of 38.8 pounds. Random samples of size 15 are drawn from this population and the mean of each sample is determined. mu Subscript x overbar=Use the central limit theorem to find the mean and standard error of the mean of the indicated sampling distribution. Then sketch a graph of the sampling distribution. The per capita consumption of red meat by people in a country in a recent year was normally distributed, with a mean of 116 pounds and a standard deviation of 38.3. pounds. Random samples of size 20 are drawn from this population and the mean of each sample is determined. μx=____