Click here for the dataset associated with this question. Give the relative frequencies rounded to three decimal places. Response No Piercing One or two piercings More than two piercings Total IM Relative Frequency
Click here for the dataset associated with this question. Give the relative frequencies rounded to three decimal places. Response No Piercing One or two piercings More than two piercings Total IM Relative Frequency

Glencoe Algebra 1, Student Edition, 9780079039897, 0079039898, 2018
18th Edition
ISBN:9780079039897
Author:Carter
Publisher:Carter
Chapter10: Statistics
Section10.6: Summarizing Categorical Data
Problem 23PPS

Related questions
Question
Transcribed Image Text:Current Attempt in Progress
Your answer is incorrect.
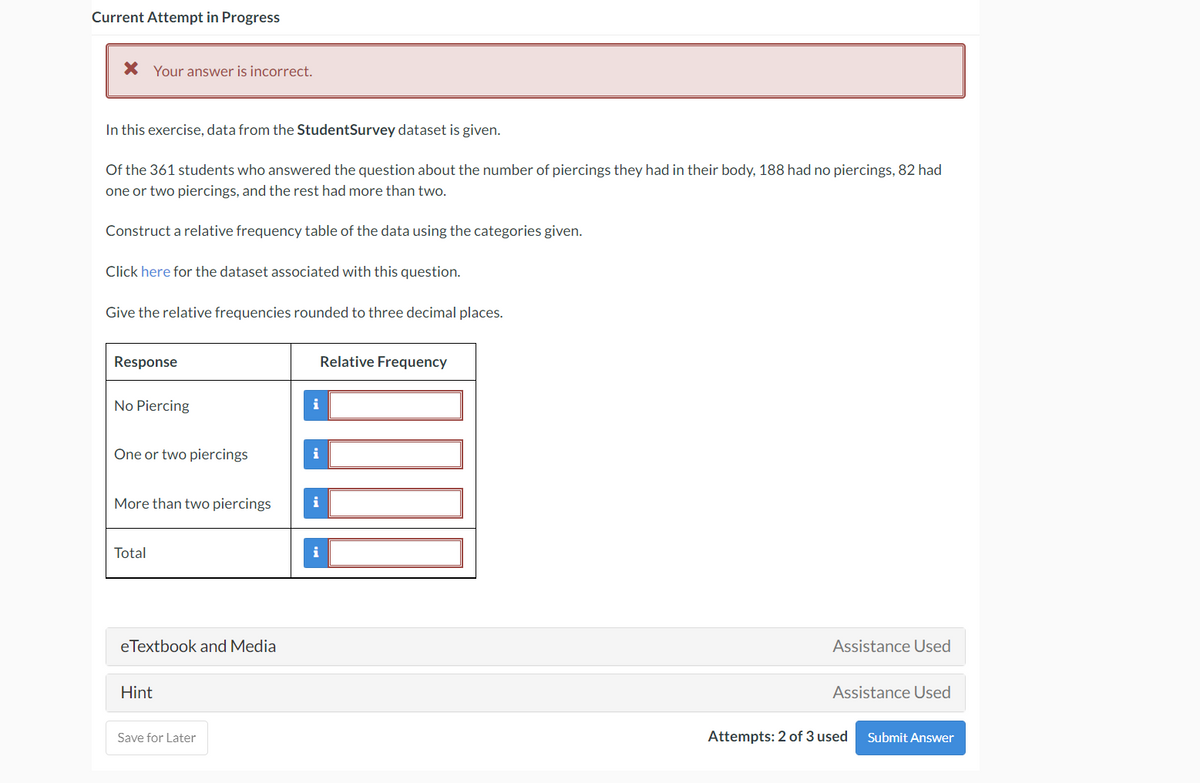
In this exercise, data from the StudentSurvey dataset is given.
Of the 361 students who answered the question about the number of piercings they had in their body, 188 had no piercings, 82 had
one or two piercings, and the rest had more than two.
Construct a relative frequency table of the data using the categories given.
Click here for the dataset associated with this question.
Give the relative frequencies rounded to three decimal places.
Response
No Piercing
One or two piercings
Total
eTextbook and Media
More than two piercings i
Hint
Save for Later
Relative Frequency
i
i
Assistance Used
Assistance Used
Attempts: 2 of 3 used
Submit Answer
Expert Solution
This question has been solved!
Explore an expertly crafted, step-by-step solution for a thorough understanding of key concepts.

Step by step
Solved in 2 steps

Recommended textbooks for you
Glencoe Algebra 1, Student Edition, 9780079039897…
Algebra
ISBN:
9780079039897
Author:
Carter
Publisher:
McGraw Hill
Glencoe Algebra 1, Student Edition, 9780079039897…
Algebra
ISBN:
9780079039897
Author:
Carter
Publisher:
McGraw Hill