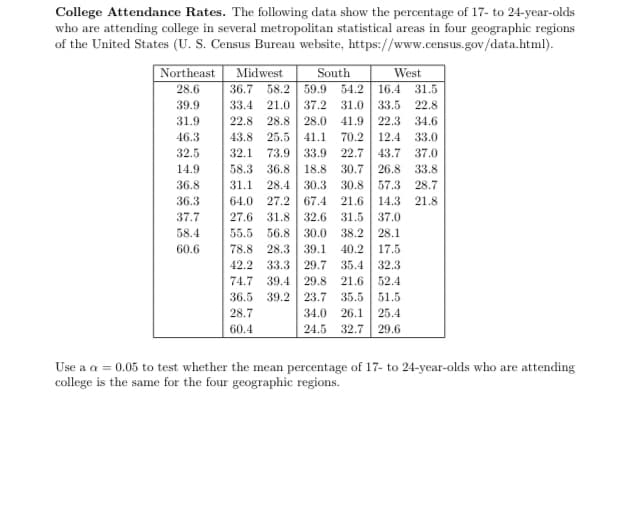
College Attendance Rates. The following data show the percentage of 17- to 24-year-olds who are attending college in several metropolitan statistical areas in four geographic regions of the United States (U. S. Census Bureau website, https://www.census.gov/data.html). Northeast 28.6 Midwest South West 36.7 58.2 59.9 54.2 16.4 31.5 39.9 33.4 21.0 37.2 31.0 33.5 22.8 31.9 22.8 28.8 28.0 41.9 22.3 34.6 46.3 43.8 25.5 41.1 70.2 12.4 33.0 32.5 32.1 73.9 33.9 22.7 43.7 37.0 14.9 58.3 36.8 18.8 30.7 26.8 33.8 36.8 31.1 28.4 30.3 30.8 57.3 28.7 36.3 64.0 27.2 67.4 21.6 14.3 21.8 37.7 27.6 31.8 32.6 31.5 37.0 38.2 28.1 40.2 17.5 35.4 32.3 58.4 55.5 56.8 30.0 60.6 78.8 28.3 39.1 42.2 33.3 29.7 74.7 39.4 29.8 21.6 52.4 36.5 39.2 23.7 35.5 51.5 28.7 34.0 26.1 25.4 60.4 24.5 32.7 29.6 Use a a = 0.05 to test whether the mean percentage of 17- to 24-year-olds who are attending college is the same for the four geographic regions.
College Attendance Rates. The following data show the percentage of 17- to 24-year-olds who are attending college in several metropolitan statistical areas in four geographic regions of the United States (U. S. Census Bureau website, https://www.census.gov/data.html). Northeast 28.6 Midwest South West 36.7 58.2 59.9 54.2 16.4 31.5 39.9 33.4 21.0 37.2 31.0 33.5 22.8 31.9 22.8 28.8 28.0 41.9 22.3 34.6 46.3 43.8 25.5 41.1 70.2 12.4 33.0 32.5 32.1 73.9 33.9 22.7 43.7 37.0 14.9 58.3 36.8 18.8 30.7 26.8 33.8 36.8 31.1 28.4 30.3 30.8 57.3 28.7 36.3 64.0 27.2 67.4 21.6 14.3 21.8 37.7 27.6 31.8 32.6 31.5 37.0 38.2 28.1 40.2 17.5 35.4 32.3 58.4 55.5 56.8 30.0 60.6 78.8 28.3 39.1 42.2 33.3 29.7 74.7 39.4 29.8 21.6 52.4 36.5 39.2 23.7 35.5 51.5 28.7 34.0 26.1 25.4 60.4 24.5 32.7 29.6 Use a a = 0.05 to test whether the mean percentage of 17- to 24-year-olds who are attending college is the same for the four geographic regions.

Glencoe Algebra 1, Student Edition, 9780079039897, 0079039898, 2018
18th Edition
ISBN:9780079039897
Author:Carter
Publisher:Carter
Chapter10: Statistics
Section10.6: Summarizing Categorical Data
Problem 4DGP

Related questions
Question
Transcribed Image Text:College Attendance Rates. The following data show the percentage of 17- to 24-year-olds
who are attending college in several metropolitan statistical areas in four geographic regions
of the United States (U. S. Census Bureau website, https://www.census.gov/data.html).
|Northeast
Midwest
South
West
28.6
36.7
58.2 | 59.9
54.2
16.4
31.5
39.9
33.4
21.0 37.2
31.0
33.5 22.8
31.9
22.8 28.8 28.0
41.9 22.3 34.6
70.2 | 12.4 33.0
22.7| 43.7
46.3
43.8
25.5
41.1
32.5
32.1
73.9 33.9
37.0
14.9
58.3 36.8 18.8
30.7
26.8 33.8
36.8
31.1
28.4 30.3
30.8 57.3 28.7
36.3
64.0 27.2 67.4
21.6
14.3 21.8
37.7
27.6 31.8 32.6
31.5 37.0
56.8 30.0
28.3 39.1
42.2 33.3 29.7
74.7 39.4 29.8 21.6 52.4
58.4
55.5
38.2 28.1
60.6
78.8
40.2
17.5
35.4
32.3
36.5
39.2 23.7
35.5
51.5
28.7
34.0 26.1
25.4
60.4
24.5
32.7
29.6
Use a a = 0.05 to test whether the mean percentage of 17- to 24-year-olds who are attending
college is the same for the four geographic regions.
Expert Solution
This question has been solved!
Explore an expertly crafted, step-by-step solution for a thorough understanding of key concepts.

This is a popular solution!

Trending now
This is a popular solution!

Step by step
Solved in 2 steps with 2 images

Recommended textbooks for you
Glencoe Algebra 1, Student Edition, 9780079039897…
Algebra
ISBN:
9780079039897
Author:
Carter
Publisher:
McGraw Hill
Glencoe Algebra 1, Student Edition, 9780079039897…
Algebra
ISBN:
9780079039897
Author:
Carter
Publisher:
McGraw Hill