The following table gives the distribution of income of households based on hypothetical data : Income % of households income % of households Under 15,000 7.2 19,000–19,999 14.9 15,000-15,999 11.7 20,000-20,999 10.4 16,000–16,999 12.1 21,000-21,999 22,000 and above 9.0 17,000-17,999 14.8 4.0 18,000–18,999 15.9 () What are the problems involved in computing standard deviation from the above data ? (i) Compute a suitable measure of dispersion. (H) Would the skewness of above disribution be affected if the income of everyone was increased by a certain proportion ?
The following table gives the distribution of income of households based on hypothetical data : Income % of households income % of households Under 15,000 7.2 19,000–19,999 14.9 15,000-15,999 11.7 20,000-20,999 10.4 16,000–16,999 12.1 21,000-21,999 22,000 and above 9.0 17,000-17,999 14.8 4.0 18,000–18,999 15.9 () What are the problems involved in computing standard deviation from the above data ? (i) Compute a suitable measure of dispersion. (H) Would the skewness of above disribution be affected if the income of everyone was increased by a certain proportion ?

MATLAB: An Introduction with Applications
6th Edition
ISBN:9781119256830
Author:Amos Gilat
Publisher:Amos Gilat
Chapter1: Starting With Matlab
Section: Chapter Questions
Problem 1P

Related questions
Question
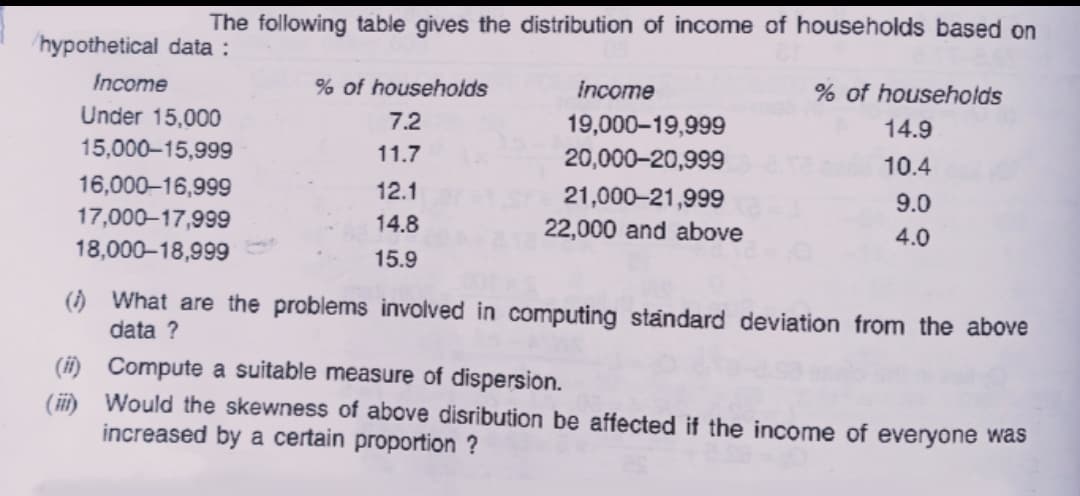
Transcribed Image Text:The following table gives the distribution of income of households based on
hypothetical data :
Income
% of households
income
% of households
Under 15,000
15,000-15,999
7.2
19,000-19,999
20,000-20,999
14.9
11.7
10.4
16,000–16,999
17,000–17,999
12.1
21,000-21,999
22,000 and above
9.0
14.8
4.0
18,000–18,999
15.9
() What are the problems involved in computing standard deviation from the above
data ?
(i) Compute a suitable measure of dispersion.
(i) Would the skewness of above disribution be affected if the income of everyone was
increased by a certain proportion ?
Expert Solution
This question has been solved!
Explore an expertly crafted, step-by-step solution for a thorough understanding of key concepts.

Step by step
Solved in 4 steps with 4 images

Recommended textbooks for you
MATLAB: An Introduction with Applications
Statistics
ISBN:
9781119256830
Author:
Amos Gilat
Publisher:
John Wiley & Sons Inc

Probability and Statistics for Engineering and th…
Statistics
ISBN:
9781305251809
Author:
Jay L. Devore
Publisher:
Cengage Learning

Statistics for The Behavioral Sciences (MindTap C…
Statistics
ISBN:
9781305504912
Author:
Frederick J Gravetter, Larry B. Wallnau
Publisher:
Cengage Learning
MATLAB: An Introduction with Applications
Statistics
ISBN:
9781119256830
Author:
Amos Gilat
Publisher:
John Wiley & Sons Inc
Probability and Statistics for Engineering and th…
Statistics
ISBN:
9781305251809
Author:
Jay L. Devore
Publisher:
Cengage Learning
Statistics for The Behavioral Sciences (MindTap C…
Statistics
ISBN:
9781305504912
Author:
Frederick J Gravetter, Larry B. Wallnau
Publisher:
Cengage Learning

Elementary Statistics: Picturing the World (7th E…
Statistics
ISBN:
9780134683416
Author:
Ron Larson, Betsy Farber
Publisher:
PEARSON

The Basic Practice of Statistics
Statistics
ISBN:
9781319042578
Author:
David S. Moore, William I. Notz, Michael A. Fligner
Publisher:
W. H. Freeman

Introduction to the Practice of Statistics
Statistics
ISBN:
9781319013387
Author:
David S. Moore, George P. McCabe, Bruce A. Craig
Publisher:
W. H. Freeman