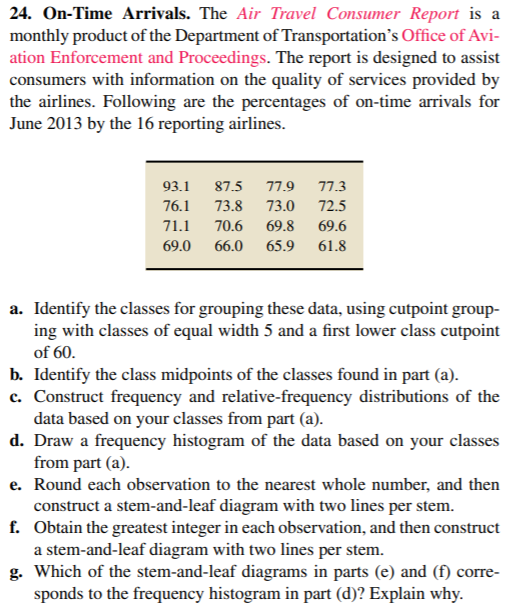
24. On-Time Arrivals. The Air Travel Consumer Report is a monthly product of the Department of Transportation's Office of Avi- ation Enforcement and Proceedings. The report is designed to assist consumers with information on the quality of services provided by the airlines. Following are the percentages of on-time arrivals for June 2013 by the 16 reporting airlines. 93.1 87.5 77.9 77.3 76.1 73.8 73.0 72.5 71.1 70.6 69.8 69.6 69.0 66.0 65.9 61.8 a. Identify the classes for grouping these data, using cutpoint group- ing with classes of equal width 5 and a first lower class cutpoint of 60. b. Identify the class midpoints of the classes found in part (a). c. Construct frequency and relative-frequency distributions of the data based on your classes from part (a). d. Draw a frequency histogram of the data based on your classes from part (a). e. Round each observation to the nearest whole number, and then construct a stem-and-leaf diagram with two lines per stem. f. Obtain the greatest integer in each observation, and then construct a stem-and-leaf diagram with two lines per stem. g. Which of the stem-and-leaf diagrams in parts (e) and (f) corre- sponds to the frequency histogram in part (d)? Explain why.
24. On-Time Arrivals. The Air Travel Consumer Report is a monthly product of the Department of Transportation's Office of Avi- ation Enforcement and Proceedings. The report is designed to assist consumers with information on the quality of services provided by the airlines. Following are the percentages of on-time arrivals for June 2013 by the 16 reporting airlines. 93.1 87.5 77.9 77.3 76.1 73.8 73.0 72.5 71.1 70.6 69.8 69.6 69.0 66.0 65.9 61.8 a. Identify the classes for grouping these data, using cutpoint group- ing with classes of equal width 5 and a first lower class cutpoint of 60. b. Identify the class midpoints of the classes found in part (a). c. Construct frequency and relative-frequency distributions of the data based on your classes from part (a). d. Draw a frequency histogram of the data based on your classes from part (a). e. Round each observation to the nearest whole number, and then construct a stem-and-leaf diagram with two lines per stem. f. Obtain the greatest integer in each observation, and then construct a stem-and-leaf diagram with two lines per stem. g. Which of the stem-and-leaf diagrams in parts (e) and (f) corre- sponds to the frequency histogram in part (d)? Explain why.

Glencoe Algebra 1, Student Edition, 9780079039897, 0079039898, 2018
18th Edition
ISBN:9780079039897
Author:Carter
Publisher:Carter
Chapter10: Statistics
Section10.6: Summarizing Categorical Data
Problem 30PPS

Related questions
Question
Transcribed Image Text:24. On-Time Arrivals. The Air Travel Consumer Report is a
monthly product of the Department of Transportation's Office of Avi-
ation Enforcement and Proceedings. The report is designed to assist
consumers with information on the quality of services provided by
the airlines. Following are the percentages of on-time arrivals for
June 2013 by the 16 reporting airlines.
93.1
87.5
77.9
77.3
76.1
73.8
73.0
72.5
71.1
70.6
69.8
69.6
69.0
66.0
65.9
61.8
a. Identify the classes for grouping these data, using cutpoint group-
ing with classes of equal width 5 and a first lower class cutpoint
of 60.
b. Identify the class midpoints of the classes found in part (a).
c. Construct frequency and relative-frequency distributions of the
data based on your classes from part (a).
d. Draw a frequency histogram of the data based on your classes
from part (a).
e. Round each observation to the nearest whole number, and then
construct a stem-and-leaf diagram with two lines per stem.
f. Obtain the greatest integer in each observation, and then construct
a stem-and-leaf diagram with two lines per stem.
g. Which of the stem-and-leaf diagrams in parts (e) and (f) corre-
sponds to the frequency histogram in part (d)? Explain why.
Expert Solution
This question has been solved!
Explore an expertly crafted, step-by-step solution for a thorough understanding of key concepts.

Step by step
Solved in 4 steps

Recommended textbooks for you
Glencoe Algebra 1, Student Edition, 9780079039897…
Algebra
ISBN:
9780079039897
Author:
Carter
Publisher:
McGraw Hill
Glencoe Algebra 1, Student Edition, 9780079039897…
Algebra
ISBN:
9780079039897
Author:
Carter
Publisher:
McGraw Hill