College X wanted to know if their student body was changing its educational make up. In 2009, College X believed that their students could be divided as follows: Education Breakdown Not a HS grad 16.00% HS grad 32.00% Some College 18.00% Associate's Degree 8.00% Bachelor's Degree 17.00% Above Bachelor's 9.00% In 2017, College X randomly polled 500 of their students and observed the new data: Education Frequency Not a HS grad 72 HS grad 159 Some college 85 Associate's degree 44 Bachelor's Degree 92 Above Bachelor's 48 Is the educational make up of the College changing? Also, what should be used? confidence intervals z-score cause/correlation/regression or Chi-Squared hypothesis tests
College X wanted to know if their student body was changing its educational make up. In 2009, College X believed that their students could be divided as follows: Education Breakdown Not a HS grad 16.00% HS grad 32.00% Some College 18.00% Associate's Degree 8.00% Bachelor's Degree 17.00% Above Bachelor's 9.00% In 2017, College X randomly polled 500 of their students and observed the new data: Education Frequency Not a HS grad 72 HS grad 159 Some college 85 Associate's degree 44 Bachelor's Degree 92 Above Bachelor's 48 Is the educational make up of the College changing? Also, what should be used? confidence intervals z-score cause/correlation/regression or Chi-Squared hypothesis tests

Holt Mcdougal Larson Pre-algebra: Student Edition 2012
1st Edition
ISBN:9780547587776
Author:HOLT MCDOUGAL
Publisher:HOLT MCDOUGAL
Chapter11: Data Analysis And Probability
Section11.4: Collecting Data
Problem 8E

Related questions
Topic Video
Question
College X wanted to know if their student body was changing its educational make up. In 2009, College X believed that their students could be divided as follows:
| Education | Breakdown |
| Not a HS grad | 16.00% |
| HS grad | 32.00% |
| Some College | 18.00% |
| Associate's Degree | 8.00% |
| Bachelor's Degree | 17.00% |
| Above Bachelor's | 9.00% |
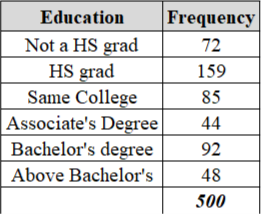
In 2017, College X randomly polled 500 of their students and observed the new data:
| Education | Frequency |
| Not a HS grad | 72 |
| HS grad | 159 |
| Some college | 85 |
| Associate's degree | 44 |
| Bachelor's Degree | 92 |
| Above Bachelor's | 48 |
Is the educational make up of the College changing?
Also, what should be used?
- confidence intervals
- z-score
- cause/
correlation /regression or Chi-Squared - hypothesis tests
Expert Solution
Step 1
Given:
The observed values are
Step 2
The expected values are
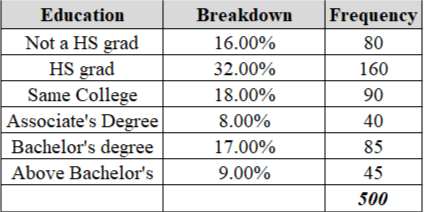
e.g. 500 × 16% = 80

Trending now
This is a popular solution!

Step by step
Solved in 3 steps with 4 images

Knowledge Booster


Learn more about
Need a deep-dive on the concept behind this application? Look no further. Learn more about this topic, statistics and related others by exploring similar questions and additional content below.Recommended textbooks for you
Holt Mcdougal Larson Pre-algebra: Student Edition…
Algebra
ISBN:
9780547587776
Author:
HOLT MCDOUGAL
Publisher:
HOLT MCDOUGAL

Glencoe Algebra 1, Student Edition, 9780079039897…
Algebra
ISBN:
9780079039897
Author:
Carter
Publisher:
McGraw Hill

College Algebra (MindTap Course List)
Algebra
ISBN:
9781305652231
Author:
R. David Gustafson, Jeff Hughes
Publisher:
Cengage Learning
Holt Mcdougal Larson Pre-algebra: Student Edition…
Algebra
ISBN:
9780547587776
Author:
HOLT MCDOUGAL
Publisher:
HOLT MCDOUGAL
Glencoe Algebra 1, Student Edition, 9780079039897…
Algebra
ISBN:
9780079039897
Author:
Carter
Publisher:
McGraw Hill
College Algebra (MindTap Course List)
Algebra
ISBN:
9781305652231
Author:
R. David Gustafson, Jeff Hughes
Publisher:
Cengage Learning
