Company analysis. Given the financial data in the popup window, E, for General Motors (GM) and Ford Motor Company (F), compare these two companies using he following financial ratios: times interest earned ratio, current ratio, total asset turnover, financial leverage, profit margin, and return on equity. Which company vould you invest in, either as a bondholder or as a stockholder? 1 Data Table Click on the following Icon e in order to past this table's content into a spreadsheet. General Motors Ford Motor Company Sales $155,465 $146,961 EBIT $7,735 $7,866 $398 $743 Interest Expense Net Income $5,332 $7,197 Current Assets $81,597 $131,452
Company analysis. Given the financial data in the popup window, E, for General Motors (GM) and Ford Motor Company (F), compare these two companies using he following financial ratios: times interest earned ratio, current ratio, total asset turnover, financial leverage, profit margin, and return on equity. Which company vould you invest in, either as a bondholder or as a stockholder? 1 Data Table Click on the following Icon e in order to past this table's content into a spreadsheet. General Motors Ford Motor Company Sales $155,465 $146,961 EBIT $7,735 $7,866 $398 $743 Interest Expense Net Income $5,332 $7,197 Current Assets $81,597 $131,452

Century 21 Accounting Multicolumn Journal
11th Edition
ISBN:9781337679503
Author:Gilbertson
Publisher:Gilbertson
Chapter17: Financial Statement Analysis
Section17.4: Analyzing Financial Statements Using Financial Ratios
Problem 1OYO

Related questions
Question
Chapter 14, Question 6. Attached is a similar question with answers. Please answer in the same formate for the new question :)
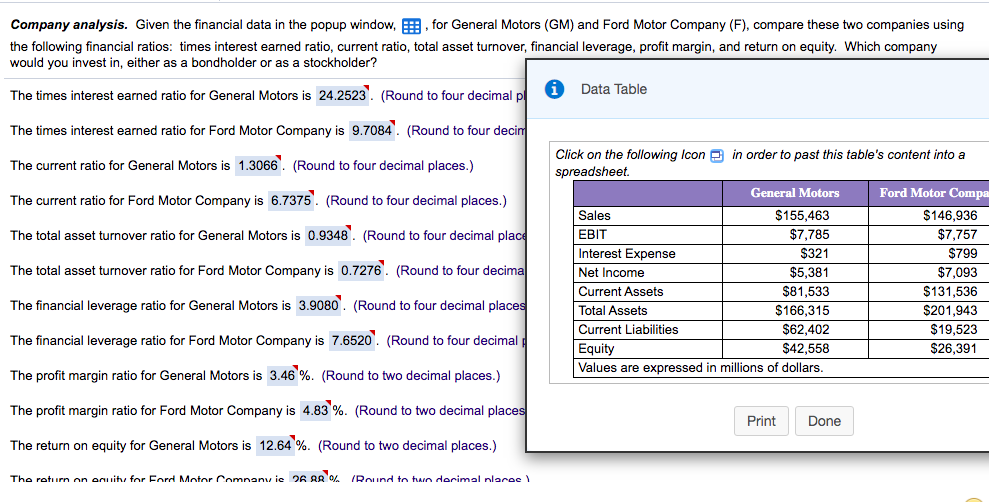
Transcribed Image Text:Company analysis. Given the financial data in the popup window, E, for General Motors (GM) and Ford Motor Company (F), compare these two companies using
the following financial ratios: times interest earned ratio, current ratio, total asset turnover, financial leverage, profit margin, and return on equity. Which company
would you invest in, either as a bondholder or as a stockholder?
The times interest earned ratio for General Motors is 24.2523. (Round to four decimal pl
i Data Table
The times interest earned ratio for Ford Motor Company is 9.7084. (Round to four decin
Click on the following Icon A in order to past this table's content into a
The current ratio for General Motors is 1.3066. (Round to four decimal places.)
spreadsheet.
The current ratio for Ford Motor Company is 6.7375. (Round to four decimal places.)
General Motors
Ford Motor Compa
Sales
$155,463
$146,936
The total asset turnover ratio for General Motors is 0.9348. (Round to four decimal place
EBIT
$7,785
$7,757
Interest Expense
$321
$799
The total asset turnover ratio for Ford Motor Company is 0.7276'. (Round to four decima
Net Income
$5,381
$7,093
Current Assets
$81,533
$131,536
The financial leverage ratio for General Motors is 3.9080'. (Round to four decimal places
Total Assets
$166,315
$201.943
Current Liabilities
$62,402
$19,523
The financial leverage ratio for Ford Motor Company is 7.6520. (Round to four decimal
$26,391
Equity
Values are expressed in millions of dollars.
$42,558
The profit margin ratio for General Motors is 3.46 %. (Round to two decimal places.)
The profit margin ratio for Ford Motor Company is 4.83 %. (Round to two decimal places
Print
Done
The return on equity for General Motors is 12.64 %. (Round to two decimal places.)
The roturn on eguity for Ford Motor Company ie 26 88'% IRound to twn decimal nlaces
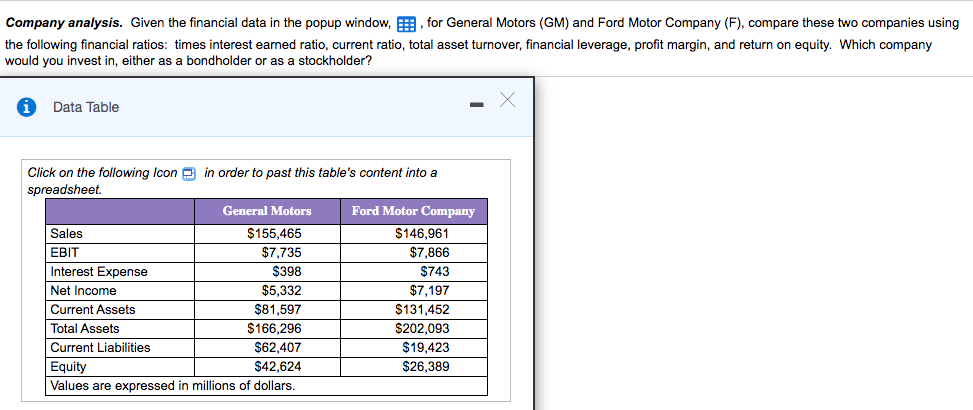
Transcribed Image Text:Company analysis. Given the financial data in the popup window, E, for General Motors (GM) and Ford Motor Company (F), compare these two companies using
the following financial ratios: times interest earned ratio, current ratio, total asset turnover, financial leverage, profit margin, and return on equity. Which company
would you invest in, either as a bondholder or as a stockholder?
Data Table
Click on the following Icon A in order to past this table's content into a
spreadsheet.
General Motors
Ford Motor Company
Sales
$155,465
$146,961
EBIT
$7,735
$7,866
Interest Expense
$398
$743
Net Income
$5,332
$7,197
Current Assets
$81,597
$131,452
Total Assets
$166,296
$202,093
Current Liabilities
$62,407
$19,423
Equity
$42,624
$26,389
Values are expressed in millions of dollars.
Expert Solution
This question has been solved!
Explore an expertly crafted, step-by-step solution for a thorough understanding of key concepts.

This is a popular solution!

Trending now
This is a popular solution!

Step by step
Solved in 3 steps with 2 images

Knowledge Booster


Learn more about
Need a deep-dive on the concept behind this application? Look no further. Learn more about this topic, finance and related others by exploring similar questions and additional content below.Recommended textbooks for you
Century 21 Accounting Multicolumn Journal
Accounting
ISBN:
9781337679503
Author:
Gilbertson
Publisher:
Cengage

Financial And Managerial Accounting
Accounting
ISBN:
9781337902663
Author:
WARREN, Carl S.
Publisher:
Cengage Learning,

Managerial Accounting: The Cornerstone of Busines…
Accounting
ISBN:
9781337115773
Author:
Maryanne M. Mowen, Don R. Hansen, Dan L. Heitger
Publisher:
Cengage Learning
Century 21 Accounting Multicolumn Journal
Accounting
ISBN:
9781337679503
Author:
Gilbertson
Publisher:
Cengage
Financial And Managerial Accounting
Accounting
ISBN:
9781337902663
Author:
WARREN, Carl S.
Publisher:
Cengage Learning,
Managerial Accounting: The Cornerstone of Busines…
Accounting
ISBN:
9781337115773
Author:
Maryanne M. Mowen, Don R. Hansen, Dan L. Heitger
Publisher:
Cengage Learning

Fundamentals of Financial Management, Concise Edi…
Finance
ISBN:
9781305635937
Author:
Eugene F. Brigham, Joel F. Houston
Publisher:
Cengage Learning

Financial Accounting
Accounting
ISBN:
9781337272124
Author:
Carl Warren, James M. Reeve, Jonathan Duchac
Publisher:
Cengage Learning

Managerial Accounting
Accounting
ISBN:
9781337912020
Author:
Carl Warren, Ph.d. Cma William B. Tayler
Publisher:
South-Western College Pub