
Concept explainers
Videos
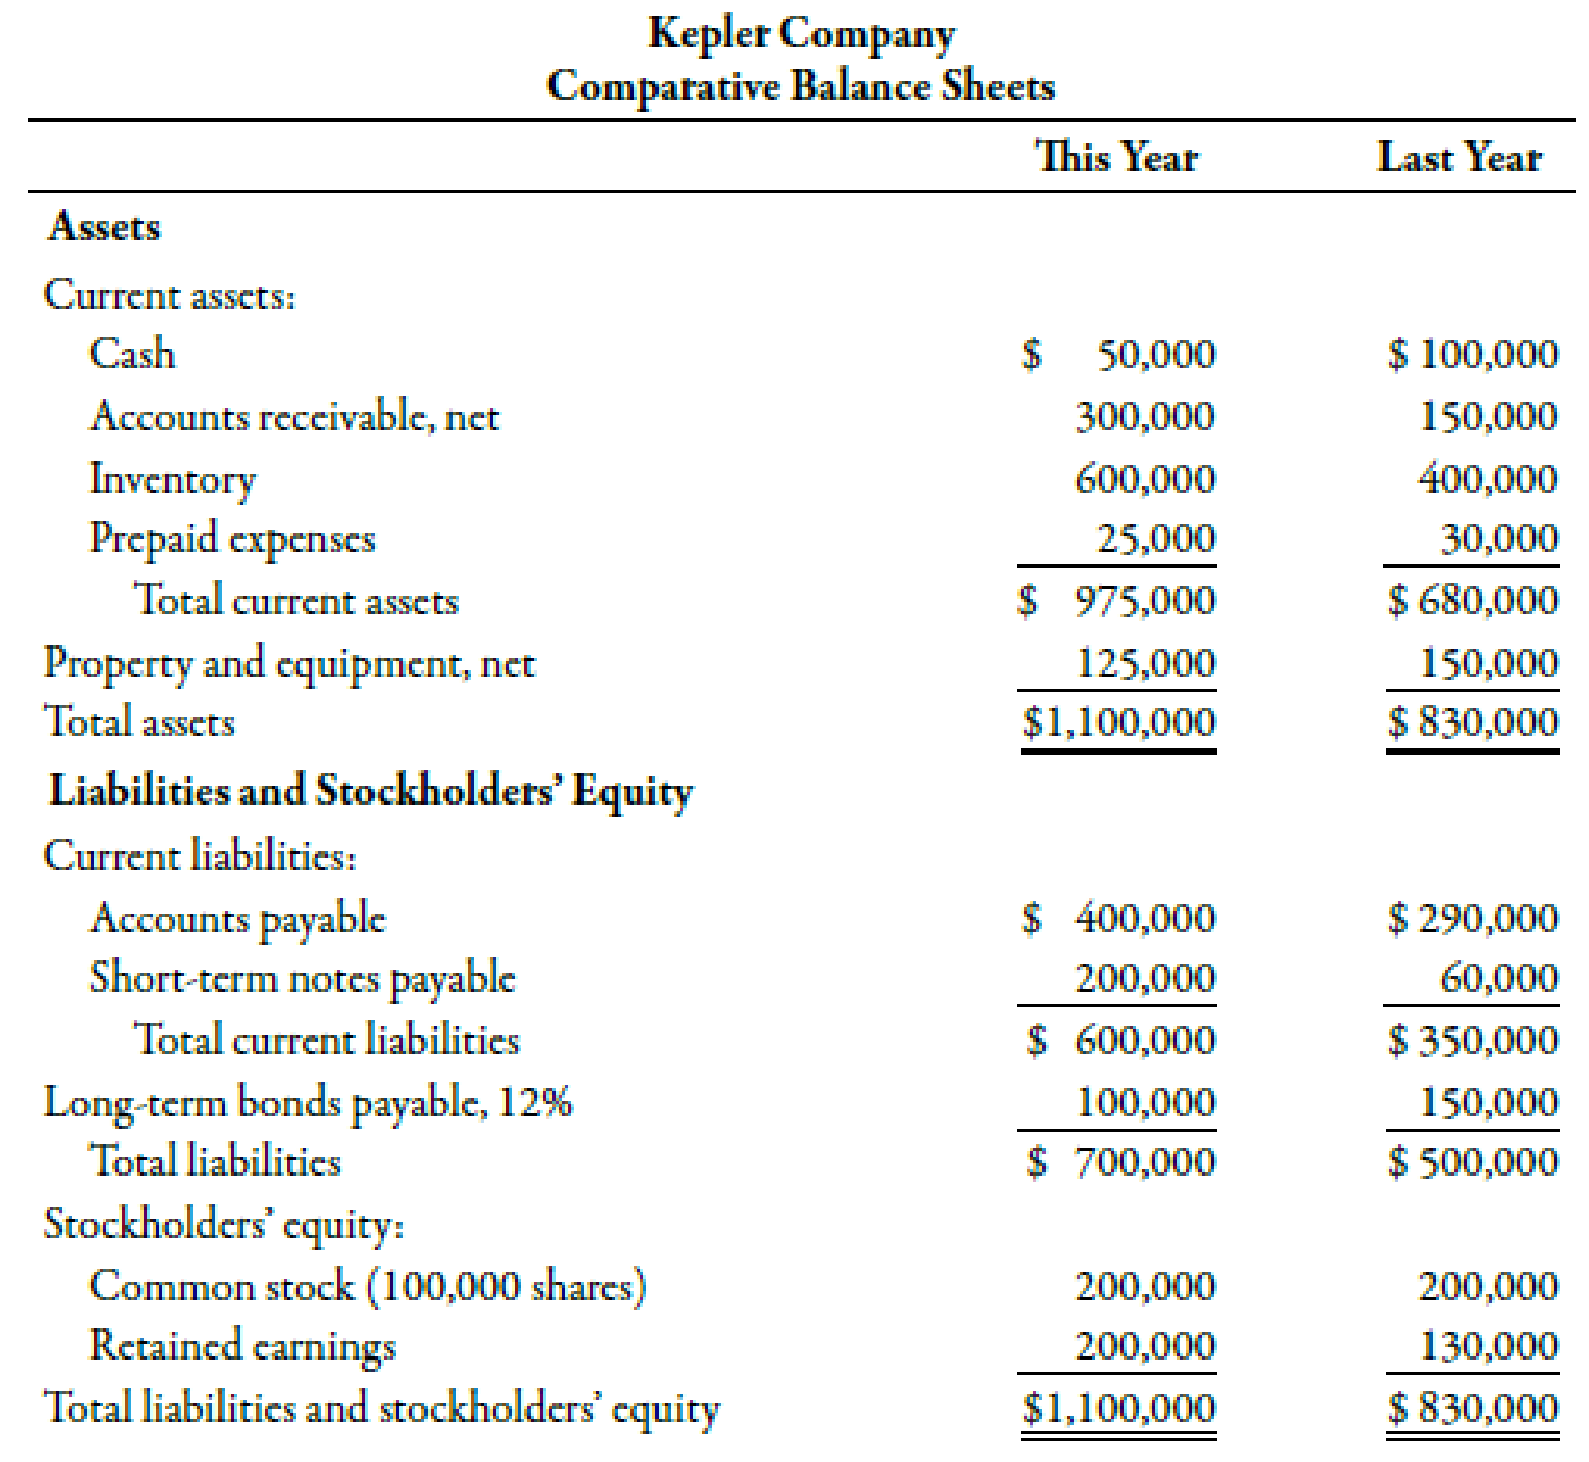
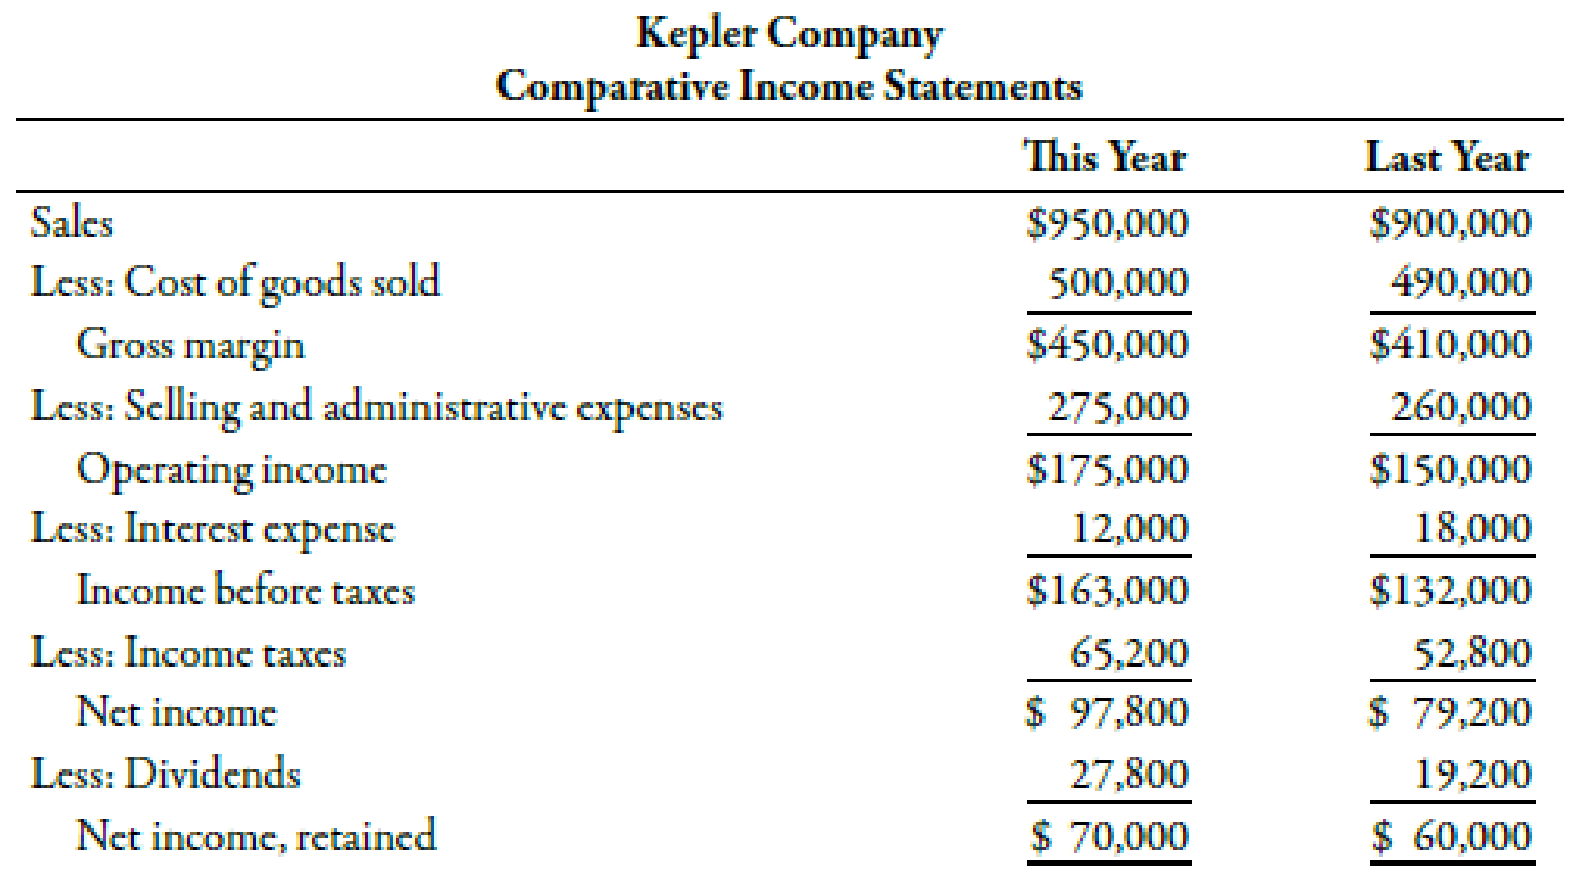
Mike Sanders is considering the purchase of Kepler Company, a firm specializing in the manufacture of office supplies. To be able to assess the financial capabilities of the company, Mike has been given the company’s financial statements for the 2 most recent years.
Required:
Note: Round all answers to two decimal places.
- 1. Compute the following for each year: (a) return on assets, (b) return on stockholders’ equity, (c) earnings per share, (d) price-earnings ratio, (e) dividend yield, and (f ) dividend payout ratio.
- 2. CONCEPTUAL CONNECTION Based on the analysis in Requirement 1, would you invest in the common stock of Kepler?
1.
Calculate the return on assets, return on stockholders’ equity, earnings per share, price earnings ratio, dividend yield and dividend payout ratio.
Explanation of Solution
Profitability Ratio:
These ratios evaluate a firm’s ability to earn profits. They help the stakeholders of the company to measure the degree to which funds invested by them are efficiently used. Some of the ratios calculated return on sales, total assets and stockholder’s equity.
(a)
Use the following formula to calculate the value of return on assets of this year:
Substitute $97,800 for net income, $12,000 for interest expense, 40% for tax rate and $965,000 for average total assets in the above formula.
Therefore, the value of return on assets is 0.11.
Use the following formula to calculate the value of return on assets of last year:
Substitute $97,880 for net income, $12,000 for interest expense, 40% for tax rate and $965,000 for average total assets in the above formula.
Therefore, the value of return on assets is 0.11.
(b)
Use the following formula to calculate the value of return on stockholder’s equity of this year:
Substitute $97,880 for net income, $0 for preference dividend and $365,000 for average common stockholder’s equity in the above formula.
Therefore, the value of return on stockholder’s equity is 0.27.
Use the following formula to calculate the value of return on stockholder’s equity of last year:
Substitute $79,220 for net income, $0 for preference dividend and $330,000 for average common stockholder’s equity in the above formula.
Therefore, the value of return on stockholder’s equity is 0.24.
(c)
Use the following formula to calculate the value of return on earnings per share of this year:
Substitute $97,800 for net income, $0 for preference dividend and 100,000 for average common shares in the above formula.
Therefore, the value of earnings per share is $0.98 per share.
Use the following formula to calculate the value of earnings per share of last year:
Substitute $79,200 for net income, $0 for preference dividend and 100,000 for average common shares in the above formula.
Therefore, the value of earnings per share is $0.79 per share.
(d)
Use the following formula to calculate the price-earnings ratio of this year:
Substitute $2.98 for market price per share and $0.98 for earnings per share in the above formula.
Therefore, the value of price-earnings ratio is 3.04.
Use the following formula to calculate the price-earnings ratio of last year:
Substitute $2.98 for market price per share and $0.79 for earnings per share in the above formula.
Therefore, the value of price-earnings ratio is 3.77.
(e)
Use the following formula to calculate the value of dividend yield of this year:
Substitute $0.278 for dividend per common shares, and $2.98 for market price per common share in the above formula.
Therefore, the value of dividend yield is 0.0933 or 9.33%.
Use the following formula to calculate the value of dividend yield of last year:
Substitute $0.192 for dividend per common shares, and $2.98 for market price per common share in the above formula.
Therefore, the value of dividend yield is 0.0644 or 6.44%.
(f)
Use the following formula to calculate the value of dividend payout ratio of this year:
Substitute $27,800 for common dividend, $97,800 for net income and $0 for preference dividend in the above formula.
Therefore, the value of dividend payout ratio is 0.28.
Use the following formula to calculate the value of dividend payout ratio of last year:
Substitute $19,200 for common dividend, $79,200 for net income and $0 for preference dividend in the above formula.
Therefore, the value of dividend payout ratio is 0.24.
Working Note:
1. Calculation of interest expense:
2. Calculation of average total assets of this year:
3. Calculation of average total assets of last year:
4. Calculation of average common stockholder’s equity of this year:
5. Calculation of average common stockholder’s equity of last year:
6. Calculation of earnings per share for this year:
7. Calculation of earnings per share for last year:
8. Calculation of dividends common shares of this year:
9. Calculation of dividends common shares of last year:
2.
Identify whether an individual should invest in Company KE on the basis of above calculations.
Explanation of Solution
The value of return on assets has remained more or less same but other ratios such as return on equity, earning per share, dividend yield and dividend payout ratio have increased. On the other hand, the price earnings ratio decreased considerably. Computation of profitability ratios have provided mixed results. An individual needs other information as well for making an investment decisions. Other information includes the comparison report of rate of return with the other companies and past data of dividend payout ratio to analyze the growth trend of the company.
Want to see more full solutions like this?
Chapter 15 Solutions
Managerial Accounting: The Cornerstone of Business Decision-Making


- Lowes Companies Inc., a major competitor of The Home Depot in the home improvement business, operates over 1,700 stores. Lowes recently reported the following balance sheet data (in millions): a. Determine the total stockholders equity at the end of Years 2 and 1. b. Determine the ratio of liabilities to stockholders equity for Year 2 and Year 1. Round to two decimal places. c. What conclusions regarding the risk to the creditors can you draw from (b)? d. Using the balance sheet data for The Home Depot in Exercise 1-26, how does the ratio of liabilities to stockholders equity of Lowes compare to that of The Home Depot?arrow_forwardAnalyze and compare Zynga, Electronic Arts, and Take-Two Data (in millions) from recent financial statements of Zynga Inc. (ZNGA), Electronic Arts Inc. (EA), and Take-Two Interactive Software, Inc. (TTWO) are as follows: a. Compute the working capital for Year 2 and Year 1 for each company. b. Which company has the largest working capital? c. Compute the current ratio for Year 2 and Year 1 for each company. Round to one decimal place. d. For Year 2, rank the companies from most liquid to least liquid based upon the current ratio.arrow_forwardThe following data (in millions) were taken from the financial statements of Costco Wholesale Corporation: a. For Costco, determine the amount of change in millions and the percent of change (round to one decimal place) from the prior year to the recent year for: 1. Revenue 2. Operating expenses 3. Operating income b. Comment on the results of your horizontal analysis in part (a). c. Based upon Exercise 2-23, compare and comment on the operating results of Target and Costco for the recent year.arrow_forward
- Lucas Hunter, president of Simmons Industries Inc., believes that reporting operating cash flow per share on the income statement would be a useful addition to the companys just completed financial statements. The following discussion took place between Lucas Hunter and Simmons controller, John Jameson, in January, after the close of the fiscal year: Lucas: Ive been reviewing our financial statements for the last year. I am disappointed that our net income per share has dropped by 10% from last year. This wont look good to our shareholders. Is there anything we can do about this? John: What do you mean? The past is the past, and the numbers are in. There isnt much that can be done about it. Our financial statements were prepared according to generally accepted accounting principles, and I dont see much leeway for significant change at this point. Lucas: No, no. Im not suggesting that we cook the books. But look at the cash flow from operating activities on the statement of cash flows. The cash flow from operating activities has increased by 20%. This is very good newsand, I might add, useful information. The higher cash flow from operating activities will give our creditors comfort. John: Well, the cash flow from operating activities is on the statement of cash flows, so I guess users will be able to see the improved cash flow figures there. Lucas: This is true, but somehow I think this information should be given a much higher profile. I dont like this information being buried in the statement of cash flows. You know as well as I do that many users will focus on the income statement. Therefore, I think we ought to include an operating cash flow per share number on the face of the income statementsomeplace under the earnings per share number. In this way, users will get the complete picture of our operating performance. Yes, our earnings per share dropped this year, but our cash flow from operating activities improved! And all the information is in one place where users can see and compare the figures. What do you think? John: Ive never really thought about it like that before. I guess we could put the operating cash flow per share on the income statement, underneath the earnings per share amount. Users would really benefit from this disclosure. Thanks for the ideaIll start working on it. Lucas: Glad to be of service. How would you interpret this situation? Is John behaving in an ethical and professional manner?arrow_forwardComparing Two Companies in the Same Industry: Chipotle and Panera Bread Refer to the financial information for Chipotle and Panera Bread reproduced at the back of the book and answer the following questions. What was the total revenue for each company for the most recent year? By what percentage did each companys revenue increase or decrease from its total amount in the prior year? What was each companys net income for the most recent year? By what percentage did each companys net income increase or decrease from its net income for the prior year? What was the total asset balance for each company at the end of its most recent year? Among its assets, what was the largest asset each company reported on its year-end balance sheet? Did either company pay its stockholders any dividends during the most recent year? Explain how you can tell.arrow_forwardDiscuss how each of the following transactions for Watson, International, will affect assets, liabilities, and stockholders equity, and prove the companys accounts will still be in balance. A. An investor invests an additional $25,000 into a company receiving stock in exchange. B. Services are performed for customers for a total of $4,500. Sixty percent was paid in cash, and the remaining customers asked to be billed. C. An electric bill was received for $35. Payment is due in thirty days. D. Part-time workers earned $750 and were paid. E. The electric bill in C is paid.arrow_forward
- Grammatico Company has just completed its third year of operations. The income statement is as follows: Selected information from the balance sheet is as follows: Required: Note: Round answers to two decimal places. 1. Compute the times-interest-earned ratio. 2. Compute the debt ratio. 3. CONCEPTUAL CONNECTION Assume that the lower quartile, median, and upper quartile values for debt and times-interest-earned ratios in Grammaticos industry are as follows: How does Grammatico compare with the industrial norms? Does it have too much debt?arrow_forwardComparing Two Companies in the Same Industry: Chipotle and Panera Bread Refer to the financial information for Chipotle and Panera Bread reproduced at the end of this book and answer the following questions: Required What is the dollar amount of inventories that each company reports on its balance sheet at the end of the most recent year? What percentage of total assets do inventories represent for each company? What does this tell you about the nature of their business? Refer to Note 1 in Chipotles annual report. What inventory valuation method does the company use? Refer to Note 2 in Panera Breads annual report. What inventory valuation method does the company use? How do both companies deal with situations in which the market value of inventory is less than its cost? Given the nature of their businesses, which inventory system, periodic or perpetual, would you expect both Chipotle and Panera Bread to use? Explain your answer.arrow_forwardAnalyze Lowes for three years Lowes Companies, Inc. (LOW), a major competitor to The Home Depot, Inc. (HD) in the home improvement retail business, operates over 1,800 stores. Lowes recently reported the following end-of-year balance sheet data (in millions): a. Compute the ratio of liabilities to stockholders equity for all three years. Round to two decimal places. b. What conclusions regarding the margin of protection to creditors can you draw from the trend in this ratio for the three years?arrow_forward
- The following information is taken from the records of Baklava Bakery for the year 2019. A. Calculate net income or net loss for January. B. Calculate net income or net loss for February. C. Calculate net income or net loss for March. D. For each situation, comment on how a stakeholder might view the firms performance. (Hint: Think about the source of the income or loss.)arrow_forwardPepsiCo, Inc. (PEP), the parent company of Frito-Lay snack foods and Pepsi beverages, had the following current assets and current liabilities at the end of two recent years: a. Determine the (1) current ratio and (2) quick ratio for both years. Round to one decimal place. b. b. What conclusions can you draw from these data about PepsiCos liquidity?arrow_forwardAnalyze The Home Depot for three years The Home Depot, Inc. (HD), is the worlds largest home improvement retailer and one of the largest retailers in the United States based on sales volume. Home Depot operates over 2,200 stores that sell a wide assortment of building, home improvement, and lawn and garden items. Home Depot recently reported the following end-of-year balance sheet data (in millions): a. Compute the ratio of liabilities to stockholders equity for all three years. Round to two decimal places. b. What conclusions regarding the margin of protection to creditors can you draw from the trend in this ratio for the three years?arrow_forward
 Managerial Accounting: The Cornerstone of Busines...AccountingISBN:9781337115773Author:Maryanne M. Mowen, Don R. Hansen, Dan L. HeitgerPublisher:Cengage Learning
 Financial Accounting: The Impact on Decision Make...AccountingISBN:9781305654174Author:Gary A. Porter, Curtis L. NortonPublisher:Cengage Learning
 Financial AccountingAccountingISBN:9781305088436Author:Carl Warren, Jim Reeve, Jonathan DuchacPublisher:Cengage Learning
 Financial AccountingAccountingISBN:9781337272124Author:Carl Warren, James M. Reeve, Jonathan DuchacPublisher:Cengage Learning
 Financial And Managerial AccountingAccountingISBN:9781337902663Author:WARREN, Carl S.Publisher:Cengage Learning,