Complete the following table by using the previous graphs to determine the values of consumer and producer surplus before the tax, and consumer surplus, producer surplus, tax revenue, and deadweight loss after the tax. Note: You can determine the areas of different portions of the graph by selecting the relevant area. Before Tax After Tax (Dollars) (Dollars) Consumer Surplus Producer Surplus Tax Revenue Deadweight Loss
Complete the following table by using the previous graphs to determine the values of consumer and producer surplus before the tax, and consumer surplus, producer surplus, tax revenue, and deadweight loss after the tax. Note: You can determine the areas of different portions of the graph by selecting the relevant area. Before Tax After Tax (Dollars) (Dollars) Consumer Surplus Producer Surplus Tax Revenue Deadweight Loss

Principles of Microeconomics
7th Edition
ISBN:9781305156050
Author:N. Gregory Mankiw
Publisher:N. Gregory Mankiw
Chapter6: Supply, Demand And Government Policies
Section: Chapter Questions
Problem 10PA

Related questions
Question
I need the bottom table to be answered. I already feel confident about the shading of the graph.
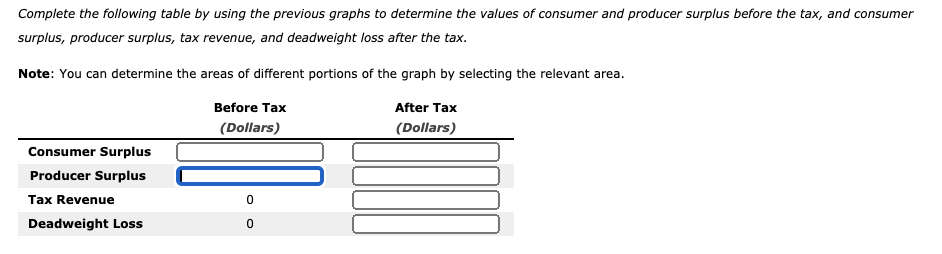
Transcribed Image Text:Complete the following table by using the previous graphs to determine the values of consumer and producer surplus before the tax, and consumer
surplus, producer surplus, tax revenue, and deadweight loss after the tax.
Note: You can determine the areas of different portions of the graph by selecting the relevant area.
Before Tax
After Tax
(Dollars)
(Dollars)
Consumer Surplus
Producer Surplus
Tax Revenue
Deadweight Loss
Transcribed Image Text:(?
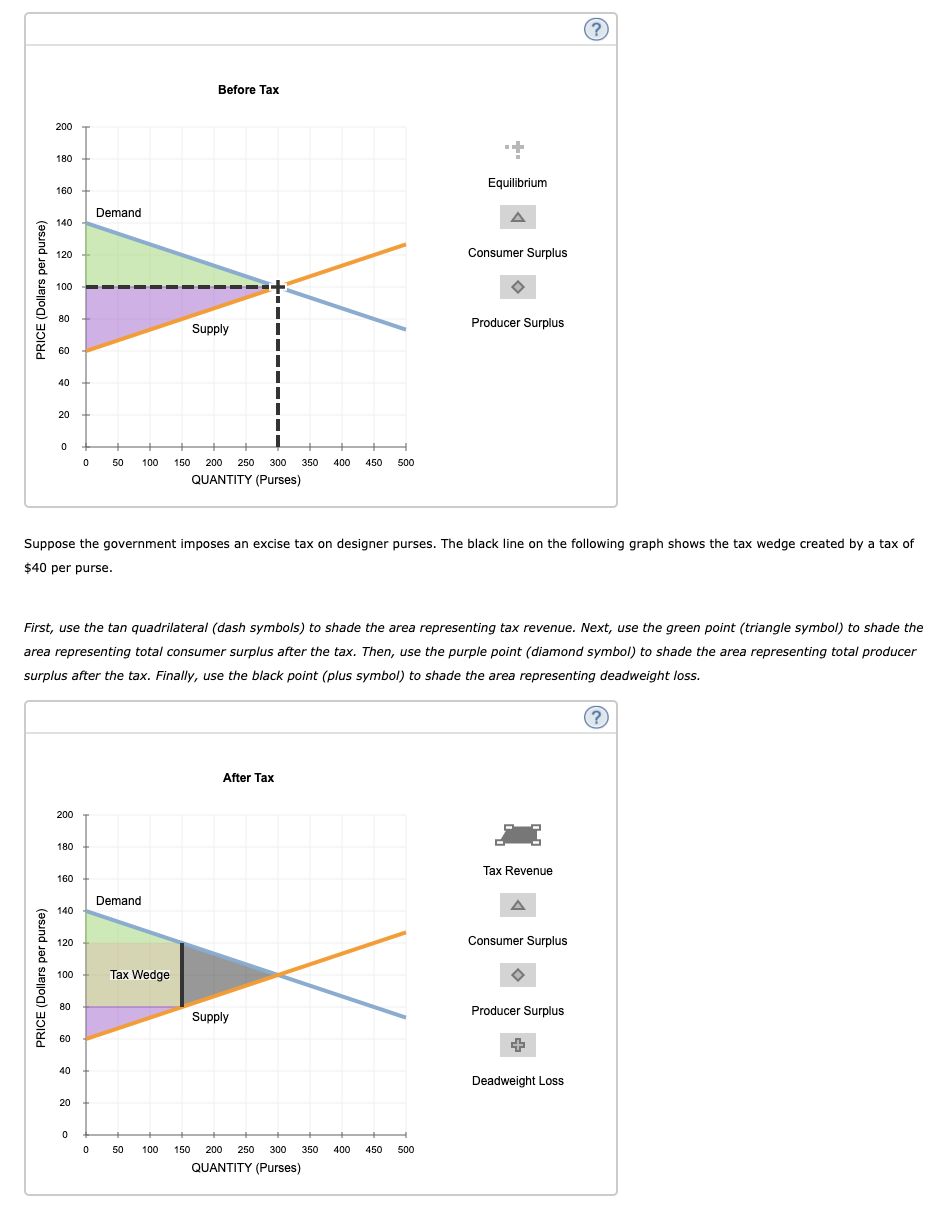
Before Tax
200
180
Equilibrium
160
Demand
140
120
Consumer Surplus
100
80
Producer Surplus
Supply
60
40
20
150 200 250 300 350
QUANTITY (Purses)
50
100
400
450
500
Suppose the government imposes an excise tax on designer purses. The black line on the following graph shows the tax wedge created by a tax of
$40 per purse.
First, use the tan quadrilateral (dash symbols) to shade the area representing tax revenue. Next, use the green point (triangle symbol) to shade the
area representing total consumer surplus after the tax. Then, use the purple point (diamond symbol) to shade the area representing total producer
surplus after the tax. Finally, use the black point (plus symbol) to shade the area representing deadweight loss.
After Tax
200
180
Tax Revenue
160
Demand
140
120
Consumer Surplus
100
Tax Wedge
80
Supply
Producer Surplus
60
40
Deadweight Loss
20
50
100
150
200
250
300
350
400
450
500
QUANTITY (Purses)
PRICE (Dollars per purse)
PRICE (Dollars per purse)
Expert Solution
This question has been solved!
Explore an expertly crafted, step-by-step solution for a thorough understanding of key concepts.

This is a popular solution!

Trending now
This is a popular solution!

Step by step
Solved in 5 steps with 2 images

Knowledge Booster


Learn more about
Need a deep-dive on the concept behind this application? Look no further. Learn more about this topic, economics and related others by exploring similar questions and additional content below.Recommended textbooks for you
Principles of Microeconomics
Economics
ISBN:
9781305156050
Author:
N. Gregory Mankiw
Publisher:
Cengage Learning

Essentials of Economics (MindTap Course List)
Economics
ISBN:
9781337091992
Author:
N. Gregory Mankiw
Publisher:
Cengage Learning

Principles of Microeconomics
Economics
ISBN:
9781305156050
Author:
N. Gregory Mankiw
Publisher:
Cengage Learning
Essentials of Economics (MindTap Course List)
Economics
ISBN:
9781337091992
Author:
N. Gregory Mankiw
Publisher:
Cengage Learning

Principles of Economics, 7th Edition (MindTap Cou…
Economics
ISBN:
9781285165875
Author:
N. Gregory Mankiw
Publisher:
Cengage Learning

Principles of Macroeconomics (MindTap Course List)
Economics
ISBN:
9781285165912
Author:
N. Gregory Mankiw
Publisher:
Cengage Learning

Principles of Economics (MindTap Course List)
Economics
ISBN:
9781305585126
Author:
N. Gregory Mankiw
Publisher:
Cengage Learning