
Principles of Microeconomics
7th Edition
ISBN:9781305156050
Author:N. Gregory Mankiw
Publisher:N. Gregory Mankiw
Chapter8: Application: The Cost Of Taxation
Section: Chapter Questions
Problem 4CQQ

Related questions
Question
PLEASE ANSWER THE GRAPHS AS WELL AS THE BOLDED QUESTIONS AND TABLES.
The government is considering levying a tax of $60 per unit on suppliers of either concert tickets or bus passes. The supply curve for each of these two goods is identical, as you can see on each of the following graphs. The demand for concert tickets is shown by DCDC (on the first graph), and the demand for bus passes is shown by DBDB (on the second graph).
Suppose the government taxes concert tickets. The following graph shows the annual supply and demand for this good. It also shows the supply curve (S+TaxS+Tax) shifted up by the amount of the proposed tax ($60 per ticket).
On the following graph, use the green rectangle (triangle symbols) to shade the area that represents tax revenue for concert tickets. Then use the black triangle (plus symbols) to shade the area that represents the deadweight loss associated with the tax.
FIRST PICTURE GOES HERE
On the following graph, do the same thing that you did on the graph for concert tickets. Use the green rectangle (triangle symbols) to shade the area that represents tax revenue for bus passes. Then, use the black triangle (plus symbols) to shade the area that represents the deadweight loss associated with the tax.
SECOND PICTURE GOES HERE
If the government wants to impose the tax that is more efficient, it should tax CONCERT OR BUS PASSES . (Hint: Assume the administrative burdens of the two tax laws are equal.)
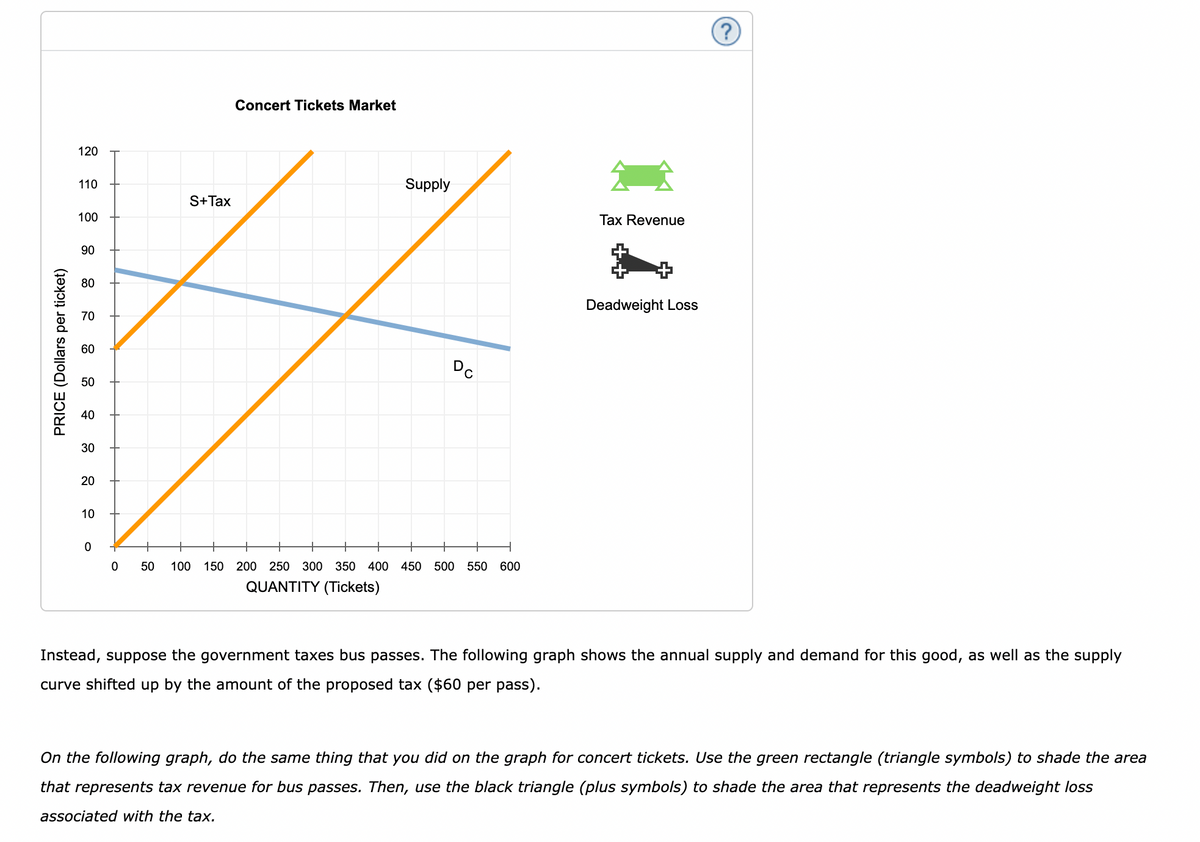
Transcribed Image Text:Concert Tickets Market
120
110
Supply
S+Tax
100
Tax Revenue
90
80
Deadweight Loss
70
60
Dc
50
40
30
20
10
50
100
150 200 250 300 350 400 450 500 550 600
QUANTITY (Tickets)
Instead, suppose the government taxes bus passes. The following graph shows the annual supply and demand for this good, as well as the supply
curve shifted up by the amount of the proposed tax ($60 per pass).
On the following graph, do the same thing that you did on the graph for concert tickets. Use the green rectangle (triangle symbols) to shade the area
that represents tax revenue for bus passes. Then, use the black triangle (plus symbols) to shade the area that represents the deadweight loss
associated with the tax.
PRICE (Dollars per ticket)
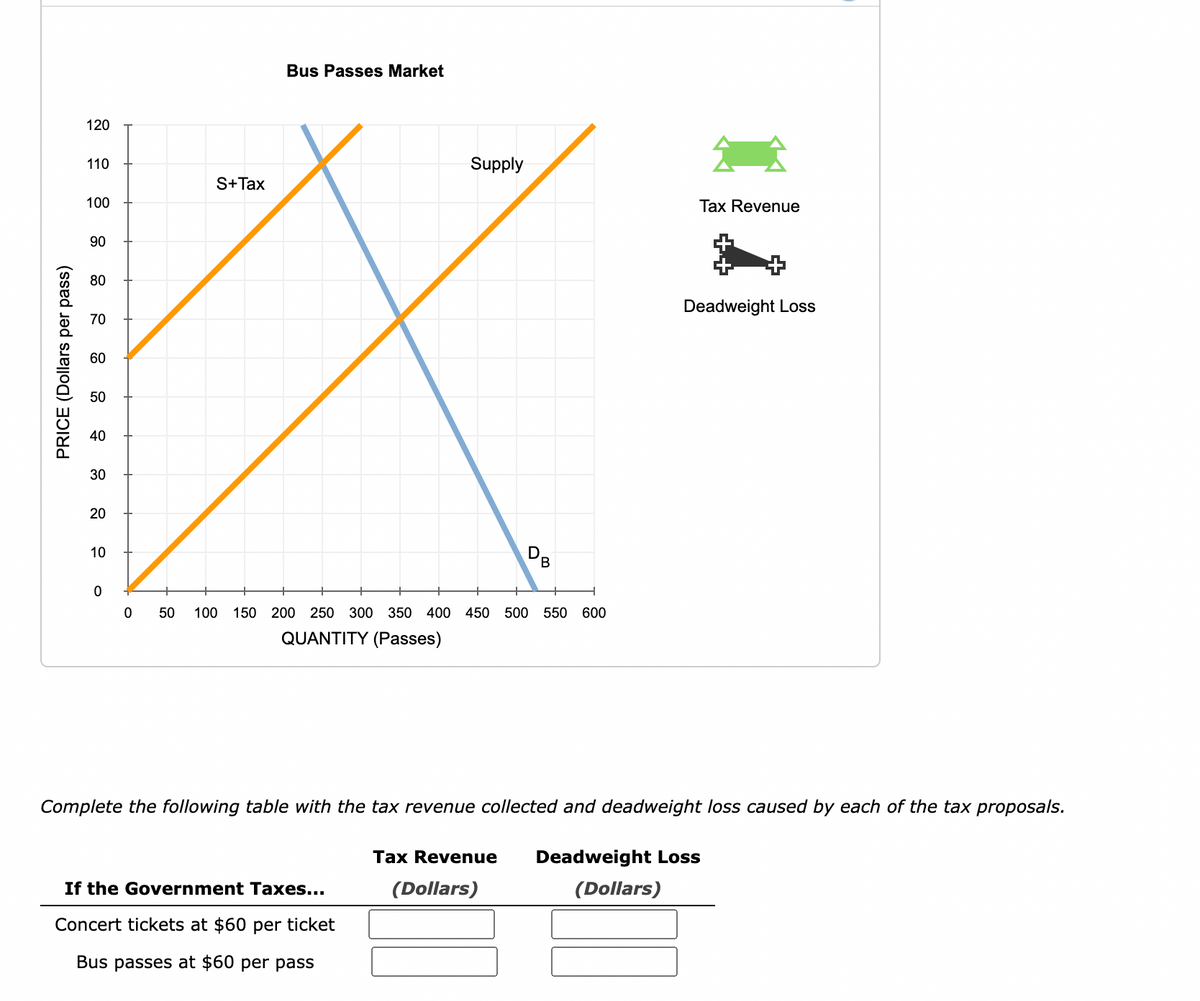
Transcribed Image Text:Bus Passes Market
120
110
Supply
S+Tax
100
Tax Revenue
90
80
Deadweight Loss
70
60
50
40
30
20
10
50
100
150
200
250 300 350 400
450 500
550
600
QUANTITY (Passes)
Complete the following table with the tax revenue collected and deadweight loss caused by each of the tax proposals.
Tax Revenue
Deadweight Loss
If the Government Taxes...
(Dollars)
(Dollars)
Concert tickets at $60 per ticket
Bus passes at $60 per pass
PRICE (Dollars per pass)
Expert Solution
This question has been solved!
Explore an expertly crafted, step-by-step solution for a thorough understanding of key concepts.

This is a popular solution!

Trending now
This is a popular solution!

Step by step
Solved in 2 steps with 3 images

Knowledge Booster


Learn more about
Need a deep-dive on the concept behind this application? Look no further. Learn more about this topic, economics and related others by exploring similar questions and additional content below.Recommended textbooks for you
Principles of Microeconomics
Economics
ISBN:
9781305156050
Author:
N. Gregory Mankiw
Publisher:
Cengage Learning

Essentials of Economics (MindTap Course List)
Economics
ISBN:
9781337091992
Author:
N. Gregory Mankiw
Publisher:
Cengage Learning

Principles of Macroeconomics (MindTap Course List)
Economics
ISBN:
9781305971509
Author:
N. Gregory Mankiw
Publisher:
Cengage Learning
Principles of Microeconomics
Economics
ISBN:
9781305156050
Author:
N. Gregory Mankiw
Publisher:
Cengage Learning
Essentials of Economics (MindTap Course List)
Economics
ISBN:
9781337091992
Author:
N. Gregory Mankiw
Publisher:
Cengage Learning
Principles of Macroeconomics (MindTap Course List)
Economics
ISBN:
9781305971509
Author:
N. Gregory Mankiw
Publisher:
Cengage Learning

Microeconomics: Principles & Policy
Economics
ISBN:
9781337794992
Author:
William J. Baumol, Alan S. Blinder, John L. Solow
Publisher:
Cengage Learning

Principles of Economics 2e
Economics
ISBN:
9781947172364
Author:
Steven A. Greenlaw; David Shapiro
Publisher:
OpenStax