Complete the table by calculating the surplus or deficit both in absolute (dollar) terms and as a percentage of GDP. If necessary, round your answers to the nearest hundredth. GDP Exports Imports Exports - Imports Year (Billions of dollars) (Billions of dollars) (Billions of dollars) (Billions of dollars) (Percentage of GDP) 2006 13,399.0 1,471.0 2,240.3 2007 14,062.0 1,661.7 2,375.7 2008 14,369.0 1,843.4 2,553.8 2009 14,119.0 1,578.4 1,964.7 2010 14,660.0 1,837.5 2,353.9 Source: "Income, Expenditures, Poverty, & Wealth: Gross Domestic Product (GDP)," United States Census Bureau, United States Department of Commerce, last modified September 2011, accessed June 10, 2013, https://www.census.gov/library/publications/2011/compendia/statab/131ed/income-expenditures-poverty-wealth.html. Between 2006 and 2007, the in dollar terms and as a percentage of GDP.
Complete the table by calculating the surplus or deficit both in absolute (dollar) terms and as a percentage of GDP. If necessary, round your answers to the nearest hundredth. GDP Exports Imports Exports - Imports Year (Billions of dollars) (Billions of dollars) (Billions of dollars) (Billions of dollars) (Percentage of GDP) 2006 13,399.0 1,471.0 2,240.3 2007 14,062.0 1,661.7 2,375.7 2008 14,369.0 1,843.4 2,553.8 2009 14,119.0 1,578.4 1,964.7 2010 14,660.0 1,837.5 2,353.9 Source: "Income, Expenditures, Poverty, & Wealth: Gross Domestic Product (GDP)," United States Census Bureau, United States Department of Commerce, last modified September 2011, accessed June 10, 2013, https://www.census.gov/library/publications/2011/compendia/statab/131ed/income-expenditures-poverty-wealth.html. Between 2006 and 2007, the in dollar terms and as a percentage of GDP.

Chapter17: Federal Deficits, Surpluses, And The National Debt
Section: Chapter Questions
Problem 7SQP

Related questions
Question
100%
This is from a practice worksheet. Please help me
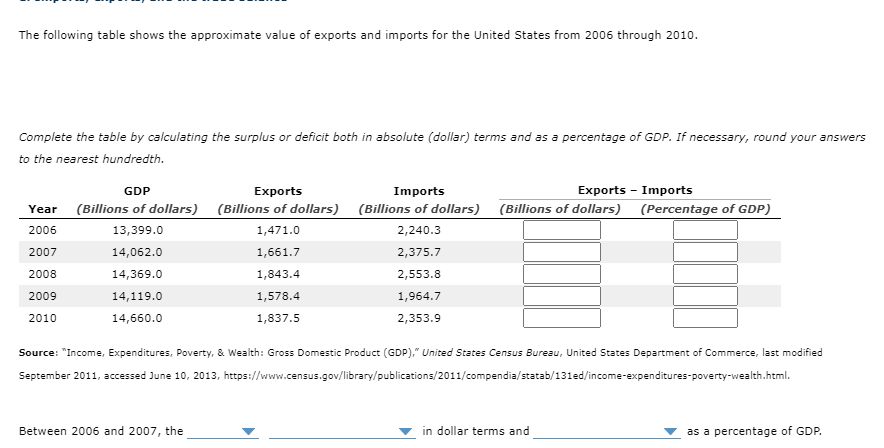
Transcribed Image Text:The following table shows the approximate value of exports and imports for the United States from 2006 through 2010.
Complete the table by calculating the surplus or deficit both in absolute (dollar) terms and as a percentage of GDP. If necessary, round your answers
to the nearest hundredth.
GDP
Exports
Imports
Exports - Imports
(Billions of dollars) (Billions of dollars) (Billions of dollars) (Billions of dollars) (Percentage of GDP)
Year
2006
13,399.0
1,471.0
2,240.3
2007
14,062.0
1,661.7
2,375.7
2008
14,369.0
1,843.4
2,553.8
2009
14,119.0
1,578.4
1,964.7
2010
14,660.0
1,837.5
2,353.9
Source: "Income, Expenditures, Poverty, & Wealth: Gross Domestic Product (GDP)," United States Census Bureau, United States Department of Commerce, last modified
September 2011, accessed June 10, 2013, https://www.census.gov/library/publications/2011/compendia/statab/131ed/income-expenditures-poverty-wealth.html.
Between 2006 and 2007, the
in dollar terms and
as a percentage of GDP.
Expert Solution
This question has been solved!
Explore an expertly crafted, step-by-step solution for a thorough understanding of key concepts.

This is a popular solution!

Trending now
This is a popular solution!

Step by step
Solved in 2 steps

Knowledge Booster


Learn more about
Need a deep-dive on the concept behind this application? Look no further. Learn more about this topic, economics and related others by exploring similar questions and additional content below.Recommended textbooks for you
