Compute


Q: The following data represent the pH of rain for a random sample of 12 rain dates. A normal…
A:
Q: Consider the time series data for the real consumption of hauseholds and government from year 1950…
A: From the given information, AR(1) AR(2) AR(3) AR(4) AR(5) Intercept 5854.66 5041.07 5365.55…
Q: (ΣΥ SP --ΣΧ- SS =Ex²- SS, = EY?. SP = r3= VSS SS, n n Use this set of data to answer questions #1 -…
A: We have given that the data of 7 participants A, B, C, D, E, F and G.
Q: The amount of time that people spend at Grover Hot Springs is normally distributed with a mean of 64…
A: GivenMean(μ)=64standard deviation(σ)=16
Q: 4. In a study, there are three independent groups. In Group 1, the scores are 2, 7, and 3; in Group…
A: The Anova is used to measure the mean significant between more than two groups. It used F…
Q: 45. A researcher measures IQ and weight for a group of college students. Which kind of correlation…
A: We have given the following statement about the correlation.
Q: Use this information to answer questions #30 - #35: A set of n = 15 pairs of scores (X and Y values)…
A: According to the given information in this question We need to find the correlation for the data…
Q: For a random variable X (which is > 0), if logX ~ N(mu, sigma^2), we call the distribution of X "log…
A: The following information has been given: A random variable X>0, logX~Nμ,σ2.The distribution is…
Q: Nationally, patients who go to the emergency room wait an average of 7 hours to be admitted into the…
A: a. In this case, the sample size is less than 30 and moreover, the population standard deviation…
Q: Curing diabetes: Vertical banded gastroplasty is a surgical procedure that reduces the volume of the…
A:
Q: 46. For which of the following Pearson's r correlations would the data points be clustered most…
A: We have the following statement about The Pearson's r correlation.
Q: Use this information to answer questions #30 - #35: A set of n = 15 pairs of scores (X and Y values)…
A:
Q: a. experiences neither depression nor weight gain. b. experiences depression given that the patient…
A: We have given that P( depression) = 0.38 P( weight gain ) = 0.28 P( depression and weight gain ) =…
Q: +++++ it. b 10. Which data set has the smallest standard deviation of the x-coordinates?
A:
Q: The mean lifetime of a tire is 3737 months with a variance of 8181. If 149149 tires are sampled,…
A: Note Thanks for your question. For the calculation, we consider question as, mean lifetime of a tire…
Q: You are conducting a multinomial hypothesis test (αα = 0.05) for the claim that all 5 categories are…
A: The objective is to test the claim at 5% level of significance that 5 categories are equally likely…
Q: It is desired to obtain a 95% confidence interval for the mean time µ= 120 minutes to take the…
A:
Q: A computer selects a number xx from 40 to 82 randomly and uniformly. The distribution is: X∼U(X∼U(…
A:
Q: 24. What is your decision regarding the null hypothesis? Reject or Fail to Reject
A: Using the given figure, we need to test for the significance of correlation coefficient between X…
Q: Price IndPrice PriceDif AdvExp Demand X1 X2 X4 X3 Y 3.85 3.80 -0.05 5.50 7.38 3.75 4.00 0.25 6.75…
A: Since you have asked multiple questions, we will solve the first question for you. If you want any…
Q: D2)  Time remaining: 00:09:45 Economics IDENTIFICATION: Identify the Term being defined by the…
A: Since we answer up to three subparts, we'll be answering the first three sub-parts. Please resubmit…
Q: 25. How did you make the determination in Question #24?
A: Using the given figure, we need to test for the significance of correlation coefficient between X…
Q: e amount of pollutants that are found in waterways near large cities is normally distributed with…
A: Givan: Mean =9.5 Standard deviation =1.7 n=37
Q: review(16a): The amount of jens monthly phone bill is normally distributed with a mean score of…
A: In question, given that The amount of jens monthly phone bill is normally distributed with a mean…
Q: i need help The Always Run Company advertises that its flashlight batteries last longer than…
A: There are 4 independent samples which are always run, competitor A, competitor B and competitor C.…
Q: Generate 20 random numbers from 1-20 and get the following data. A. Mean B. Median C. Mode
A: According to bartleby policy I have solved first three subparts of this question.
Q: In a survey of 3,800 adults concerning complaints about restaurants, 1,456 complained about dirty or…
A: Given that Sample size n =3800 Favorable cases x =1456 , for about dirty. Sample proportion p^=x/n…
Q: Suppose babies born after a gestation period of 32 to 35 weeks have a mean weight of 2700 grams and…
A: Given For period (32to35) Mean =2700, standard deviation =600 For period (after 40 weeks) Mean…
Q: For numbers 8 to 10: The owner of a newly opened bakery is interested to know if the mean moisture…
A: The given table represents one way ANOVA with 3 independent samples. We have to find the value of…
Q: A normal distribution has a mean of µ = 40 with σ = 10. If a vertical line is drawn through the…
A:
Q: QUESTION 6 Using R, generate a graph to represent respondents by length of time they had their last…
A: From the given information, Q404 column represents the length of time they had their lastPap smear.…
Q: Identify the sample space of the probability experiment and determine the number of outcomes in the…
A: Given that Randomly choosing a number from the odd numbers between 20 and 30 Sample space = Odd…
Q: Ho. Hence, at 5% level of significance, we have evidence 7. If the test yielded a p-value = 0.09, we…
A: Test is that whether there is a difference between the mean length of clams from the sites with and…
Q: Grand mean=14.82 Calculate effect size using the formula d=(M-u)/
A: Analysis of variance is a useful inferential statistic.
Q: You plan to draw distinct cards from a regular deck that I hold. a. How many number of ways of…
A: We know that the regular deck card contains 52 cards.
Q: Listed below are the lead concentrations (in ug/g) measured in different Ayurveda medicines.…
A: Solution-: (a) We identify the null and alternative hypothesis (b) Identify the test statistic (c)…
Q: Nationally, patients who go to the emergency room wait an average of 7 hours to be admitted into the…
A: Given that Sample size n =15 Sample mean =5.4 Standard deviation =2.7 NOTE:- According to bartleby…
Q: a-- IA 1) - 16 - (3+ 1- 12 Excel output for the hospital labor needs case (sample size: A 16) value…
A: Hello! As you have posted more than 3 sub parts, we are answering the first 3 sub-parts. In case…
Q: (c) Compute the P-value. Round the P-value to at least four decimal places. P-value= %3D
A: Given that Hypothesized Population Mean (\mu)(μ) = 3500035000 Sample Standard Deviation (s)(s)…
Q: ropriate Test Statist
A: Given that Population mean μ =200 Level of significance =5%=0.05
Q: Generate 10 random numbers from 1-10 and get the following data. A. 1st Quartile B. 3rd Decile C.…
A: GivenGenerate 10 random numbers from 1-10 then then data set is 10,7,8,1,9,3,6,5,2,4sample…
Q: 1. Generate 10 random numbers from 1-10 and get the following data. A. Mean B. Median C. Mode
A: As per our guidelines we can solve first three sub part of question and rest can be reposted.
Q: How does the cost of shipping a standard-sized crate relate to the distance of the destination? Can…
A: distance charges 14 1400 23 2000 9 800 17 1600 10 1620 22 1900 5 620 12 1440 6 900…
Q: Perform a test of hypothesis at 5% level of significance to help the labour union leader make an…
A: Here population standard deviation unknown so use t-test
Q: llphone provider has the business objective of wanting to estimate the proportion of subscribers who…
A:
Q: Determine the population of interest. Select the correct choice below and, if necessary, fill in the…
A: Given that Sample size n =1000 Favorable cases x =248 Sample proportion p^=x/n
Q: Chi-Square Distribution A survey is conducted among workers in Pasig City to determine if there is…
A: A survey is conducted among workers in Pasig City to determine if there is any difference between…
Q: Population Positive Covid 19 No Name density/Km2 Day 1 Day 2 Day 3 Day 4 Day 5 Day 6 Day 7 Day 8 Day…
A: First we enter the given data set in Excel file. Add all the day's values and create a new column…
Q: 1. Grade Point Averages The average undergraduate grade point average (GPA) for the 25 top-ranked…
A: Given data is…
Q: In order to see which brand of golf balls is best (as measured by distance travelled), an experiment…
A: In the given problem we have given that three groups and respectively those are, 1. Callaway 2. Nike…
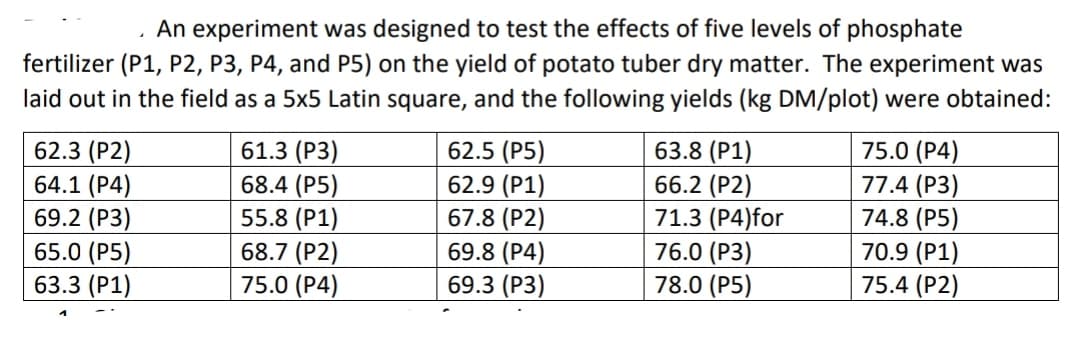
Compute the relative efficiency of this design over RCBD.

Step by step
Solved in 3 steps with 1 images

- Compare the two separate scatterplots. In particular, how do the associtation compare between women with pets vs. women without pets? Does one group have more variation in systolic blood pressure than the other? If so, for which group? Does systolic blood pressure seem higher for common ages between the two groups? If so, for which group?the soil biogeochemistry in Californian salt marshes wished to explore how two of the most common plant species, pickleweed and pacific cordgrass, affected the accumulation of nitrogen in the soil. They measured the concentration of ammonium, a molecular form of organic nitrogen, in the soil, and measured or manipulated the density of pickleweed and cordgrass. Manipulations of ½ meter square plots (20 plots per manipulation) included removing all cordgrass (cordgrass removal), removing all pickleweed (pickleweed removal), or mixed (the control - nothing removed, thus mixed plots included a mixture of natural pickleweed and cordgrass). Boxplots of ammonium concentrations in each of the three manipulation treatments. Letters indicate differences among means as determined by a Tukey posthoc test following ANOVA. (b) Overall relationship between cordgrass stem density and soil ammonium content (includes data from all plot treatments). The solid black line and the gray shading represent the…In an agricultural experiment, the effects of two fertilizers on the production of limes were measured. Twenty-three randomly selected plots of land were treated with a brand new fertilizer, and 21 randomly selected plots were treated with an old fertlizer. The number of pounds of harvested limes were measured from each plot. The results are given below. (Round answers to two decimal places.)Data: New Fertilizer Old Fertilizer 412 480 434 472 436 485 418 453 412 470 415 464 412 482 438 466 439 481 443 470 427 472 426 466 439 493 427 471 438 495 430 479 411 467 424 476 419 493 424 485 425 482 437 420 Find a 90% confidence interval for the difference between the mean weight of the harvested limes.margin of error: lower limit: upper limit: Based on the results, is the new fertilizer better than the old fertilizer? Yes, we are 90% confident that new fertilizer is better than old fertilizer. It's not clear if the new fertilizer is…
- In an agricultural experiment, the effects of two fertilizers on the production of limes were measured. Fourteen randomly selected plots of land were treated with a brand new fertilizer, and 18 randomly selected plots were treated with an old fertlizer. The number of pounds of harvested limes were measured from each plot. The results are given below. (Round answers to two decimal places.) New F. Old F. 498 429 485 428 469 427 481 421 472 412 475 419 488 431 468 436 460 415 469 428 475 417 471 437 476 437 470 420 416 426 427 419 Find a 99% confidence interval for the difference between the mean weight of the harvested limes.margin of error: lower limit: upper limit:The average weight of a Coastal male Grizzly Bear is approximately normal with E(x); =795 pounds and SD * (x) = 80 pounds. 8. How likely is it to randomly select 64 Coastal male Grizzly Bears with a sample average weight of 810 pounds or more? Which density curve is the best model for this problem?In an agricultural experiment, the effects of two fertilizers on the production of limes were measured. Nineteen randomly selected plots of land were treated with a brand new fertilizer, and 27 randomly selected plots were treated with an old fertlizer. The number of pounds of harvested limes were measured from each plot. The results are given below. (Round answers to two decimal places.) New Fertilizer Old Fertilizer 486 435 468 423 491 425 470 440 458 423 476 409 456 425 463 443 493 402 501 437 483 420 475 420 456 416 470 435 463 421 473 445 479 422 460 424 467 412 435 427 413 407 420 430 426 430 Find a 90% confidence interval for the difference between the mean weight of the harvested limes.margin of error: lower limit: upper limit: Based on the results, is the new fertilizer better than the old fertilizer? A) Yes, we are 90% confident that new fertilizer is better than old fertilizer. B) No, we are 90%…
- For a research study with 2 levels of factor A, 4 levels of factor B, and n = 8 in each treatment condition, what are the df values for the F-ratio evaluating the main effect for factor A?a. Compute the incidence rate of coronary artery disease in patients receiving the new cholesterol medication. b. Compute the incidence rate of coronary artery disease in patients receiving a placebo. attached is the image of the data for this problemIn forestry, the diameter of a tree at breast height is used to model the height of the tree. Silviculturists working in British Columbia’s boreal forest conducted a series of spacing trials to predict the heights of several species of trees. The data are the breast height diameters (in centimeters) and heights (in meters) for a sample of 18 white spruce trees. B1 B2 18.9 20.0 15.5 16.8 19.4 20.2 20.0 20.0 29.8 20.2 19.8 18.0 20.3 17.8 20.0 19.2 22.0 22.3 16.6 18.8 15.5 16.9 13.7 16.3 27.5 21.4 20.3 19.2 22.9 19.8 14.1 18.5 10.1 12.1 5.8 8.0 B1: Breast Height Diameter of White spruce (cm) B2: Height (m) a) Plot the relationship using scatter diagram between the breast height diameters and the trees’ height. Are the breast height diameters and the trees’ height linearly related? What can you infer about the relationship between the two variables? Is a linear model appropriate? b) Compare the scatter plot in (a) with the correlation coefficient…
- In a test of braking performance, a tire manufacturer measured the stopping distance for one of its tire models. On a test track, a car made repeated stops from 100 kilometres per hour. The test was run on both dry and wet pavement, with the accompanying results.The performance of two analysts in determining total mercury (mg / kg) in fish was evaluated using the absorption spectrometry method. The results on the concentrations of mercury found in fish, for each analyst, are presented in the table below: Analyst 1 Analyst 2 7 12 9 8 6 9 11 13 13 14 8 9 7 8 13 10 12 7 9 15 (a)Is the performance in determining total mercury for Analyst 1 more accurate than Analyst 2? Compare the accuracy in the results of the two analysts at a 95% confidence level. Explain. (b)Are the results obtained by the two analysts, in the concentrations of mercury found in the fish, statistically equivalent, with 95% confidence? ExplainIf a newborn lab rat receives a hormone and its weight (in ounces) is converted into a z score that is greater than +2.00, what would the researcher most likely conclude about whether or not the hormone had an effect on the rat's weight?
