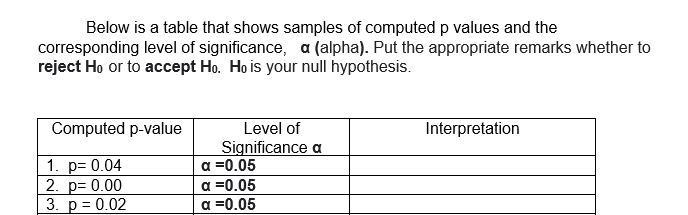
Computed p-value 1. p= 0.04 2. p= 0.00 3. p = 0.02 Level of Significance a a =0.05 a =0.05 a =0.05 Interpretation


Q: 1. In an attempt to assess the effect of the length of time spent in using social media to the…
A: a)
Q: Classify the events as independent or not independent. Events A and B where P(A) = 0.6, P(B) = 0.9,…
A: Events A and B where P(A) = 0.6, P(B) = 0.9, and P(A and B) = 0.54
Q: A tobacco company advertises that the average nicotine content of its cigarettes is at most 14…
A:
Q: (5) Based on the mean and standard deviation, which of the scores are extremely high or extremely…
A: The z-score of the given data values tells how far raw data is from the mean in terms of the…
Q: The rule that describes the percentage of data within 1, 2, and 3 standard deviation of the mean is…
A:
Q: 9. For the standard normal variable Z, find the probability of P (0 -1.89) if Z is a standard normal…
A: Solution
Q: Prof. Lopez wants to know whether type of the exam formats will impact on student’s final exam by…
A: Repeated measures t-test is a design in which a single sample of participants is measured twice on…
Q: 6. It is known that the tensile strength of a plastic increases as a function of the time it is heat…
A:
Q: Suppose that in College Entrance Test, the cutoff score for passing is 85. If the mean of the test…
A:
Q: 08:00 AM INJVC > Module 2 Assessments > Chapt If an orange tree sapling is planted, it has a 80%…
A:
Q: Suppose that a number is randomly chosen from the interval (-6,6). What is the probability that…
A:
Q: Determine the probability that in a sample of 100 the sample proportion is less than .75 if p = 0.80
A: Given, Sample size, n = 100 Population proportion, p =0.8 Z = p^-pp1-pn
Q: The data found below measure the amounts of greenhouse gas emissions from three types of vehicles.…
A: Using a 0.025 significance level, we need to test the claim that the different types of vehicle have…
Q: 1. Find the critical value (s) for the t-test for each. 1. 2. 3. n = 15, α = 0.05, right-tailed n =…
A:
Q: In the population of drivers, the mean number of traffic violations in the last 10 years is 5.2. In…
A: It is given that Population mean = 5.2 Sample mean = 4.25
Q: What is the symbol n 3.2 after the word at
A:
Q: 30 55 27 45 56 48 45 49 32 57 47 56 37 55…
A: “Since you have posted a question with multiple sub-parts, we will solve first three subparts for…
Q: Let X be a random variable representing the number of times that you have to roll two dice until you…
A: Here, the given context follows negative binomial distribution with k = 10 and p = 118 (probability…
Q: A stats class was interested in determining the percentage of students on their campus who are…
A: Given Information: Sample size n=95 proportion p1=0.35 Margin of error E=0.098 Second case: Sample…
Q: Assume that you are interested in whether or not expenditures per pupil are related to the average…
A: According to guidelines we solve first three subparts when given multiple subparts.
Q: The accompanying table lists the ages of acting award winners matched by the years in which the…
A: The provided information is x y xy x2 y2 29 41 1189 841 1684 31 36 1116 961 1296 29 38 1102…
Q: The heights of North American women are normally distributed with a mean of 64 inches and a standard…
A: Given data The heights of north American women are normally distributed with mean of 64 inches and a…
Q: Find the area and normal curve Greater than z = -0.78
A:
Q: In 1980, women who were under 50 years old had a mean body weight of 145 pounds, with a standard…
A: Given Population of study - women who were under 50 years Mean, μ = 145 Standard deviation, σ = 20
Q: Consider a constant function: f(x)= c; a ≤ x ≤ b Suppose that the function represents a…
A: Given info: f(x)= c; a ≤ x ≤ b the function represents a probability density function and c<1.
Q: You want to obtain a sample to estimate how much parents spend on their kids birthday parties. Based…
A: It is given that confidence level is 0.98, the population standard deviation is 35.1 and the margin…
Q: (i) How would you determine whether two or more continuous variables of a population are associated?…
A: Given information: Variable: 1. X. 2. Y X:(5,8,13,15,19,6,12,20,25,28,27,30)…
Q: Automotive Engineers tested the gas mileage in kilometers per Liter (km/L) of a certain passenger…
A: The provided information is x¯=15s2=2.5s=1.58n=25α=0.001 df =n-1=25-1 df=24 The critical value is…
Q: SUBJECT: ENGINEERING DATA ANALYSIS TOPIC: Test of Hypothesis NOTE: Make the solution detailed and…
A: The following information has been provided. Sample size 1 = 25 Sample size 2= 36 Sample mean 1= 80…
Q: Find the area under the normal curve between Z-scores of -0.57 and -1.42 -1.5
A:
Q: you did not answer d, the last part of the question
A: d) Let A denote the event that the participants preference for the the NBA Sport Let B denote the…
Q: X 0 1 2 3 4 P(x) 0.11 0.34 0.45 0.03 0.07
A:
Q: Note: Give an interpretation of your results. 1. In a survey conducted by BS Psychology students, of…
A: Formula : CI=p̂ ± ME
Q: 2. Lung cancer is considered as one of the leading causes of death in both women and men in the…
A: The question is about sample size estimation Given : True prop. of people who develop lung cancer…
Q: 1. What is the correlation of the correlation coefficient for the bivariate data? [Select] 2. Is…
A: The provided information is x y xy x2 y2 1.2 6.7 8.04 1.44 44.89 1.5 7.8 11.7 2.25 60.84…
Q: A researcher is exploring the relationship of academic performance of students in an online class to…
A: We have given that A correlation coefficient of 1
Q: Conduct a hypothesis test by going through the six steps A college math teacher claims that the…
A:
Q: In a sample of n = 4, three subjects have scores that are 1 point below the mean each. The 4th…
A:
Q: Nestle Philippines wants to estimate the average annual milk consumption in a province. A random…
A:
Q: c. The probability that wave will crash onto the beach exactly 1.3 seconds after the person arrives…
A: Given Information: The waves are crashing onto the beach every 4.3 seconds. a=0, b=4.3
Q: From the long time ex_perience, it is kn=own that the str_ength of a specific wire made by an…
A: Hypothesis testing is used to test a claim about the population parameter of interest.
Q: The Greens are moving. Their real estate agent located 81 houses listed for sale in their price…
A: This question can be solved by Venn - diagram very easily. Given 45 had a finished basement 50 had…
Q: 4. What is the equation of the regression line? [Select] 5. Using the regression line model, predict…
A: Use the Excel and Perform the Regression. Followings are the Steps to perform the Regression 1) Open…
Q: 1. Compute the mean cost per vaccine to the nearest centavos 2. Compute for the standard deviation…
A: Mean let x1,x2,x3,........,xn be the n observations. Then the mean is defined by…
Q: Find the area of the shaded region. The graph depicts the standard normal distribution of bone…
A:
Q: Maaño Auto Tire sells all types of tires, but a popular radial tire accounts for a large portion of…
A: We need to simulate the Demand for tires using a random number table. Let us assume that each of the…
Q: A researcher is conducting a study on the palliative care patients at a specific facility to…
A: Wilcoxon test is a non parametric test.
Q: students at Harvard to answer this question. Use a DAG to illustrate your research question and…
A: Research Research as a scientific and systematic approach for pertinent information on a specific…
Q: Standard Residuals 1.979463878 0.76560249 1.510106436 1.496613187 -0.121345141 -0.422635952…
A: Standardized residuals have significant role in regression analysis.
Q: A senior high school teacher is interested in knowing the average number of hours a teacher works in…
A: A senior high school teacher is interested in knowing the average number of hours a teacher works in…

Step by step
Solved in 3 steps

- The average expenditure per student (based on average daily attendance) for a certain school year was $10,337 with a population standard deviation of $1560. A survey for the next school year of 150 randomly selected students resulted in a sample mean of $10, 798. Find the Z statistics? Should the null hypothesis be rejected at alpha = .05 level of significance?The average expenditure per student (based on average daily attendance) for a certain school year was $10,337 with a population standard deviation of $1560. A survey for the next school year of 150 randomly selected students resulted in a sample mean of $10, 798. Find the P-value? Should the null hypothesis be rejected at alpha = .05 level of significance?A trucking firm is considering the installation of a new, low-restriction engine air filter for its long-haul trucks, but doesn’t want to make the switch unless the new filter can be shown to improve the fuel economy of these vehicles. A test is set up in which each of 10 trucks makes the same run twice once with the old filtration system and once with the new version. Given the sample results shown below, use the 0.05 level of significance in determining whether the new filtration system could be superior. Truck Number Current Filter (mpg) New Filter (mpg) 1 7.6 7.3 2 4.1 7.2 3 10.4 6.8 4 6.9 10.6 5 5.6 8.8 6 7.9 8.7 7 5.4 5.7 8 5.7 8.7 9 5.5 8.9 10 5.3 7.1 Do reject or fail to reject H0?
- This chart shows the results of two random samples that measured the average number of minutes per charge for AA Lithium-ion (Li-ion) rechargeable batteries versus Nickel-Metal Hydride (NiMH) rechargeable batteries. Down below shows the hypothesis test using significance level (α) = 0.05 to determine if the true average number of minutes per charge for NiMH batteries is smaller than that for Li-ion batteries. 1. From the data given from the first graph below, what would be the correct p value? (the one tail or the two tail?) t-Test: Two-Sample Assuming Unequal Variances NiMH Li-ion Mean 89.35714 95 Variance 3.93956 59.75 Observations 14 17 Hypothesized Mean Difference 0 df 19 t Stat -2.89621 P(T<=t) one-tail 0.004628 t Critical one-tail 1.729133 P(T<=t) two-tail 0.009255 t Critical two-tail 2.093024 For the bottom graph: 1.. Find the point estimate (you can do this by subtracting Group 2…Five samples of a ferrous-type substance were used to determine if there is a difference between a laboratory chemical analysis and an X-ray fluorescence analysis of the iron content. Each sample was split into two subsamples and the two types of analysis were applied, with the accompanying results. Assuming that the populations are normal, test at the 0.05 level of significance whether the two methods of analysis give, on the average, the same result. Determine the test statistic t=?Listed below are the heights (in inches) of fathers and their first sons. The dataare from a journal kept by Francis Galton. Use a 0.05 significance level to testthe claim that there is no difference in heights between fathers and their firstsons. (State the null and alternate hypothesis, the p-value method to make adecision, and write a conclusion based on the results.) Height of Father 72.0 66.0 69.0 70.0 70.0 70.0 70.0 75.0 68.265.0Height of Son 73.0 68.0 68.0 71.0 70.0 70.0 71.0 71.0 70.063.0
- For a special pre-New Year's Eve show, a radio station personality has invited a small panel of prominent local citizens to help demonstrate to listeners the adverse effect of alcohol on reaction time, thus drinking an alcohol increases reaction time. The reaction times (in seconds) before and after consuming four drinks are in Sheet 11. Test a hypothesis to see if the showman claim is supported by the given data (use alpha=0.01 significance level). Sheet 11 Subject Before After 1 0,32 0,39 2 0,39 0,44 3 0,36 0,49 4 0,41 0,53 5 0,37 0,46 6 0,35 0,39 7 0,37 0,49 8 0,37 0,52 9 0,32 0,43 10 0,39 0,45 11 0,39 0,39 12 0,41 0,49 13 0,32 0,48 14 0,38 0,48 15 0,34 0,4 16 0,35 0,52 Select one: a. The alternative hypothesis that the reaction time before consuming alcohol is less than after is not accepted as the p-value= 0.0000 is less than alpha=0.005 b. The Null hypothesis that the reaction time before consuming alcohol is less than after is rejected…A sample of 20 third-grade students had a average of 54 on a math proficiency test, with a sample standard deviation of 11. Is there enough evidence to conclude that the third-grade sample mean differs significantly from the third-grade population mean of 67? Assume a 0.02 significance level. Use the Critical Value Method of Testing (this means NO P-Values!). will need to have -1. The null hypothesis, Ho 2. The alternative hypothesis, H1 3. The test statistic4. The type of test(left, right, two-tailed) and the p-value 5. The decision to accept Ho or reject HoThe NAEP considers that a national average of 283 is an acceptable performance. Using α = .05, run a two-tail t-test for one sample to test Ho: µ=283 for the 2019 scores. Report the t-obt, df, and p-values. Would you reject the null hypothesis that the 2019 scores come from a population with average 283? If this is the case, does it come from a population from larger or smaller average?
- A store that sells LPG claims that the mean weight of their tanks are exactly 11-kgs as prescribed. Using a random sample of 15 LPG tanks, a regular customer tests the theory that the average weight of the store's tanks are somehow lower than the prescribed weight. Use a significance level of α=0.10the assumption that the t test for independent samples makes regarding the amount of variability in each of the two groups is called the?Use the pulse rates in beats per minute (bpm) of a random sample of adult females listed in the data set available below to test the claim that the mean is less than 69bpm. Use a 0.05 significance level. Determine the p-value, test statistic, and whether to reject or support the null hypothesis. Pulse Rates (bpm)4758945542428462993656838640967652866179101964387103596043524566974010140833853398649613552933856446594


