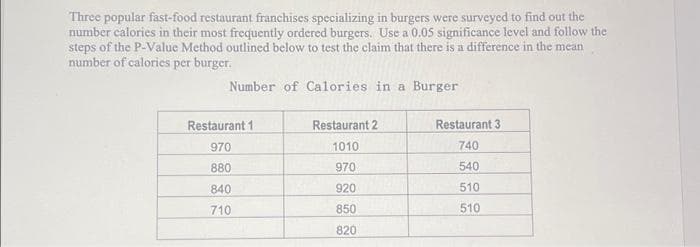
Three popular fast-food restaurant franchises specializing in burgers were surveyed to find out the number calories in their most frequently ordered burgers. Use a 0.05 significance level and follow the steps of the P-Value Method outlined below to test the claim that there is a difference in the mean number of calories per burger. Number of Calories in a Burger Restaurant 1 970 880 840 710 Restaurant 2 1010 970 920 850 820 Restaurant 3 740 540 510 510


Q: The point estimate for p. p, is (Round to three decimal places as needed.) The point estimate for q,…
A: Here Given n= 1899 x= 907
Q: I am attempting to make three data sets that conform to the following expectations using as many or…
A: In this question, we explore the creation of three distinct data sets with specific characteristics…
Q: what percent of values fall between 5.25 and 8.75 if the mean =9 and standard deviation =2.36
A: Answer: From the given data, Mean (μ) = 9 Standard deviation (σ) = 2.36 X follows normal…
Q: A box contains 10,000 tickets: 4,000 zeros and 6,000 ones. And 10,000 draws will be made at random…
A: As the draws are obtained without replacement, the population size decreases with each additional…
Q: The sample mean X is to be used to estimate the mean u of a normal distribution with standard…
A: The question is about sample size estimation Given : Std. deviation of normal dist. ( σ ) = 4 inches…
Q: Q32 If X is a binomial random variable with n = 8 and p = 0.6, what is the probability that X is…
A: The question is about discrete prob. distribution Given : No. of trials ( n ) = 8 Prob. of success (…
Q: Listed below are annual data for various years. The data are weights (metric tons) of imported…
A: Lemon Imports Crash Fatality Rate 229 15.8 226 15.7 359 15.5 484 15.3 534 14.8
Q: 3. 1, 2, Ig aleatory sample (0, 2). Calculate PM+>> refers to the order statistics)
A: Given that x1, x2, and x3 are independent random variables following a uniform distribution U(0, 2),…
Q: ^ For a linear regression problem, the least squares line is y = 2x+2. Determine the predicted value…
A: Y=2x+2 x=5
Q: Ch: Estimating Random Variables Q: The minimum of two independent exponential random variables with…
A: In this problem, we are given that we have two independent exponential random variables with a mean…
Q: Indicate the level of measurement for the data set described. Weights of newborn babies a. interval…
A: We need to indicate the scale of measurement used for the weight of newborn babies.
Q: For each of the following, indicate whether a correlation is most likely POSITIVE, NEGATIVE or NC…
A: Given the statements to indicate whether a correlation is most likely POSITIVE, NEGATIVE, or NC (no…
Q: In order to control costs, a company wishes to study the amount of money its sales force spends…
A: (a) Use EXCEL Procedure for finding the values of mean and the variance. Follow the instruction to…
Q: 2. Imagine that, instead of estimating y = XB+, you estimate y = Zy+ & where Z = XP with P being a…
A: It is estimated y=Zγ+ε where Z=XP with P being a non-singular matrix which transforms the columns of…
Q: Two independent samples are selected at random from two normal populations, where the unknown…
A: Suppose μ1 and μ2 denote the population mean of first and second populations, respectively. A two…
Q: + 7 + + 8 9 10 11 12 13 14 15 16 17 18 19 20 data Based on the boxplot above, identify the 5 number…
A: box plot for given data we have to identify five number summary and IQR.
Q: 1. Researches are interested in whether or not the average fuel economy for compact cars is the same…
A:
Q: 36) The time X needed to complete a final examination in a particular College Course is normally…
A: The Z-score for the random variable X equals 70 is obtained below as follows: From the…
Q: In a right-tailed test, the p-value is the area under the distribution curve to the right of the O…
A: Here we have to identify the correct option regarding right tailed test for the p-value
Q: You are conducting a study to see if the accuracy rate for fingerprint identification is…
A: The information provided in the question are as follows :- Population proportion p=38% and the…
Q: A sample of 150 married women determined that 127 are happy in their marriage. A sample of 150…
A: The data is given as- for women, n1=150x1=127 For men, n2=150p2^=x2n2=0.76
Q: The accompanying table shows results from a study in which some dental patients were treated with…
A: Answer Given level of significance =0.05 H0: The presence of any adverse health conditions is…
Q: Find the critical value to for the confidence level c = 0.95 and sample size n = 28. Click the icon…
A: Sample size n =28
Q: The number of births per woman in China is 1.6 down from 5.91 in 1966. This fertility rate has been…
A: # of births Frequency 0 5 1 30 2 10
Q: When subjects were treated with a drug, their systolic blood pressure readings (in mm Hg) were…
A: The data shows the systolic blood pressure readings readings of before and after the drug was taken.
Q: Answer the following questions. You may use R on your own computer. 1) [ State the assumption of…
A: In the given model, the dependent variable is average credit card balance which is studied using an…
Q: Given the following data: Vegetable Sweet Carrot Yes Potato No Onion Yes Celery No Starchy Firm Yes…
A: The data is as follows: Vegetable Sweet Starchy Firm Vitamin Water Calories/100g Carrot Yes Yes…
Q: Is it possible to assist to determing how to find the answers to the following: How do I make the…
A: In this question, we explore the relationship between the mean, median, and mode of a set of numbers…
Q: a. As the data are graphed, which is the independent and which the dependent variable? The…
A: “Since you have asked multiple questions, we will solve the first question for you. If you want any…
Q: 8. Eight different gifts are distributed among 3 people at a gathering, where all eight gifts are…
A: Given that, No. of different gifts (n) = 8 No. of people at a gathering (r) = 3 To find the possible…
Q: Historically, about 53% of the population of a certain country believed that the planet's…
A: claim : p ≠ 0.53n = 950x = 516α = 0.05
Q: In a random sample of four mobile devices, the mean repair cost was $65.00 and the standard…
A: From the provided information, Sample size (n) = 4 Sample mean (x̄) = 65.00 Sample standard…
Q: X 123456 у 4 11 28 59 140 300
A: The data is given as- X Y 1 4 2 11 3 28 4 59 5 140 6 300
Q: Mark Price, the new productions manager for Speakers and Company, needs to find out which variable…
A: Independent variables : Unit price & Advertising Dependent variable : Unit sales i.e., We wish…
Q: Provide an appropriate response. A survey claims that 9 out of 10 doctors (i.e., 90%) recommend…
A: Test statistic z = -1.95
Q: Adverse reactions of a drug used to help patients continue their abstinence from the use of alcohol…
A: Level of significance =0.05 H0: drug treatment and adverse effects are independent. H1: drug…
Q: What is the relationship between the number of minutes per day a woman spends talking on the phone…
A: Since you have posted a question with multiple sub-parts, we will solve first three sub- parts for…
Q: the answer was incorrect
A: Answer…
Q: The following table shows the systolic blood pressure of 5 certified public accountants before tax…
A: Since you have posted a question with multiple sub-parts, we will solve first three sub- parts for…
Q: Following are age and price data for 8 randomly selected ambulances between 1 and 6 years old. Here,…
A: X : { 6,1,6,2,6,2,4,5 } Y : { 260,420,255,370,280,350,315,300 } N=8 ΣX = 32 ΣY = 2550 ΣXY = 9390…
Q: U Toys has developed a new product―the (PHAF). They are now deciding how to market the doll.One…
A: The scenario involves University Toys (U Toys), which has developed a new product called PHAF…
Q: Randomly selected deaths of motorcycle riders in a region of the northern hemisphere are summarized…
A: Month Number Jan 7 Feb 11 March 12 April 16 May 20 June 30 July 26 Aug 27 Sept 23…
Q: 2. Energy consumption in homes and in a school. lo obtain the information, a group was asked to…
A: As per the honor code and guidelines, we are supposed to solve only three sub-parts. I request you…
Q: Calculate the measures of central tendency (mean, median, and mode) and the measures of dispersion…
A: The data represents the values of the monthly salaries (in dollars) of a group of teachers at an…
Q: Do these data indicate any significant differences among the three methods? Test with a = .05.
A: Anova is the measure used to determine the mean significant between the three or more groups. It is…
Q: The following are the ratings of men by women in an experiment involving speed dating. Use the given…
A: The question is about 5 no. summary and graphical representation of the data Given : To find : 1…
Q: A 99% confidence interval for the population proportion is (.). (Round to three decimal places as…
A: sample size = n = 2309 X = 739 Confidence level = 99%
Q: The data below are the final exam scores of 10 randomly selected statistics students and the number…
A: As per our guidelines we can solve first multiple-choice question and rest can be reposted. Q.1…
Q: archaeology club has 20 members. How many different ways can the club select A. 116,280 B. 465,120…
A: The total number of members=20 The selected number of members=4 Here we have to use formula for…
Q: Please no written by hand solution and no img A researcher is interested in mother contingent…
A: The one sample proportion z test will be used to compare the difference between known proportion and…
Subjevt : Statestic

Step by step
Solved in 3 steps with 1 images

- The manager of a computer software company wishes to study the number of hours per week senior executives by type of industry spend at their desktop computers. The manager selected a sample of five executives from each of three industries. At the 0.05 significance level, can she conclude there is a difference in the mean number of hours spent per week by industry? Banking Retail Insurance 12 8 10 10 8 8 10 6 6 12 8 8 10 10 10A grassroots group opposed to a proposed increase in the gas tax claimed that the increase would hurt working-class people the most, since they commute the farthest to work. Suppose that the group randomly surveyed 24 individuals and asked them their daily one-way commuting mileage. The results are in Table below. Using a 5% significance level, test the hypothesis that the three mean commuting mileages are the same. working-class professional (middle incomes) professional (wealthy) 17.8 16.5 8.5 26.7 17.4 6.3 49.4 22.0 4.6 9.4 7.4 12.6 65.4 9.4 11.0 47.1 2.1 28.6 19.5 6.4 15.4 51.2 13.9 9.3A researcher was interested in comparing the salaries of female and male employees at a particular company. Independent simple random samples of 8 female employees and 15 male employees yielded the following weekly salaries (in dollars). Female Male 495 722 518 760 562 904 556 880 1150 904 520 805 520 500 480 1005 1250 970 743 750 605 660 1640 Use a 0.01 significance level to test the claim that the mean salary of female employees is less than the mean salary of male employees.
- On snow-covered roads, winter tires enable a car to stop in a shorter distance than if summer tires were installed. In terms of the additive model for one-way ANOVA, and for an experiment in which the mean stopping distances on a snow-covered road are measured for each of four brands of winter tires. If the data are as shown in Sheet 48, what conclusion would be reached at the 0.01 level of significance? Shett 48 Supplier A 517 484 463 452 502 447 481 500 485 566 Supplier B 479 499 488 430 482 457 424 488 526 455 Supplier C 435 443 480 465 435 430 465 514 463 510 Supplier D 526 537 443 505 468 533 481 477 490 470 Select one: a) p-value = 0.28 greater than 0.05, the average distance is different for at list two tires b) F stat = 1.86, F crit = 4.38, not enough evidence to claim that the average distance is different for at list two tires c) F ratio = 4.38, not enough evidence to claim that the average distance is different for at list two tires d) F stat = 0.68, F…The accompanying table lists heights (in inches) of randomly selected fathers and their first sons. Use a 0.05 significance level to test the claim that there is no difference in heights between fathers and their first sons. HeightofFatherHeightofSon69.468.071.471.368.870.569.071.571.072.965.367.767.264.670.370.266.969.568.271.361.564.968.669.969.571.374.074.871.367.968.170.872.773.471.873.573.873.271.177.471.573.469.867.169.667.569.368.667.167.966.066.969.570.768.070.966.170.065.165.268.865.672.071.672.169.568.770.765.267.071.871.971.574.172.272.570.573.870.769.468.565.467.469.871.373.869.171.669.072.170.069.573.071.169.169.569.570.469.173.267.369.168.772.467.368.769.269.076273210/30/21, 12:18 AM Heightshttps://www.mathxl.com/Student/PlayerTest.aspx?testId=230138677 2/276.2 73.265.4 69.969.1 78.170.5 72.468.3 72.268.5 71.169.3 71.864.2 65.168.4 69.768.3 71.070.7 69.667.2 71.671.7 72.065.3 69.766.1 70.665.4 71.370.7 69.866.9 69.770.1 70.364.9 70.164.0 70.3 In this example, μd…A major food manufacturer is concerned that the sales for its skinny french fries have been decreasing. As a part of a feasibility study, the company conducts research into the types of fries sold across the country to determine if the type of fries sold is INDEPENDENT of the area of the country. The results of the study are shown in the table below. Conduct a test of INDEPENDENCE. (Use a significance level of 0.05.) Type of Fries Northeast South Central West skinny fries 70 50 19 24 curly fries 100 59 16 30 steak fries 21 41 9 9
- In order to investigate a claim that the average time required for the county fire department to respond to a reported fire is greater than 15 minutes, county staff determined the response times for 40 randomly selected fire reports. The data was used to test H0H0: μ = 15 versus HaHa: μ > 15 and the computed P‐value was 0.12. If a 0.05 level of significance is used, what conclusions can be drawn? There is convincing evidence that the mean response time is 15 minutes (or less). There is convincing evidence that the mean response time is greater than 15 minutes. There is not convincing evidence that the mean response time is greater than 15 minutes.A standardized math test was administered to two groups of 5th graders, one group sampled from classes whose teachers had followed the existing curriculum and one group sampled from classes whose teachers had followed a new curriculum, and the scores were compared using a t-test with the following results: t-test: Two-Sample Assuming Equal Variances Old Curriculum New Curriculum Mean 75.31914894 65.65957447 Variance 118.613321 801.1424607 Obervations 47 47 Hypothesized Mean Difference 0 df 92 t Stat 2.183587807 P(T<=t) one-tail 0.015768226 t Critical one-tail 1.661585397 P(T<=t) two-tail 0.031536452 t Critical two-tail…A computer manufacturer believes that the proportion of hardware malfunctions is different in humid climates than in dry climates. To test this claim, the manufacturer takes a random sample of 400 machines sold in Florida (humid) and 400 machines sold in Arizona (dry). The manufacturer finds that 44 of the machines in Florida and 24 of the machines in Arizona had hardware malfunctions. d. Does the evidence support the computer manufacturer's claim at the 10% significance level?
- A senior accounting major at Midsouth State University has job offers from four CPA firms. To explore the offers further, she asked a sample of recent trainees from each firm: How many months did you work before receiving a raise in salary? Using the following ANOVA table, is there a difference in the mean number of months before receiving a raise among the four firms? Use the 0.01 level of significance. Analysis of Variance Source SS df MS F p Factor 31.00 3 10.33 5.44 0.008 Error 32.34 17 1.90 Total 63.34 20 a. What are the null and alternate hypotheses? H0: H1: b. What is the test statistic? (Round your answer to 2 decimal places.) c. What is the p-value? (Round your answer to 3 decimal places.) d. What is your decision regarding the null hypothesis? e. Interpret the result.A senior accounting major at Midsouth State University has job offers from four CPA firms. To explore the offers further, she asked a sample of recent trainees from each firm: How many months did you work before receiving a raise in salary? Using the following ANOVA table, is there a difference in the mean number of months before receiving a raise among the four firms? Use the 0.05 level of significance. Analysis of Variance Source df SS MS F p Factor 3 39.56 13.19 9.77 0.001 Error 15 20.26 1.35 Total 18 59.82 a. What are the null and alternate hypotheses? b. What is the test statistic? (Round your answer to 2 decimal places.) c. What is the p-value? (Round your answer to 3 decimal places.) d. What is your decision regarding the null hypothesis? e. Interpret the result.A senior accounting major at Midsouth State University has job offers from four CPA firms. To explore the offers further, she asked a sample of recent trainees from each firm: How many months did you work before receiving a raise in salary? Using the following ANOVA table, is there a difference in the mean number of months before receiving a raise among the four firms? Use the 0.05 level of significance. Analysis of Variance Source df SS MS F p Factor 3 39.56 13.19 9.77 0.001 Error 15 20.26 1.35 Total 18 59.82 b. What is the test statistic? (Round your answer to 2 decimal places.) c. What is the p-value? (Round your answer to 3 decimal places.)